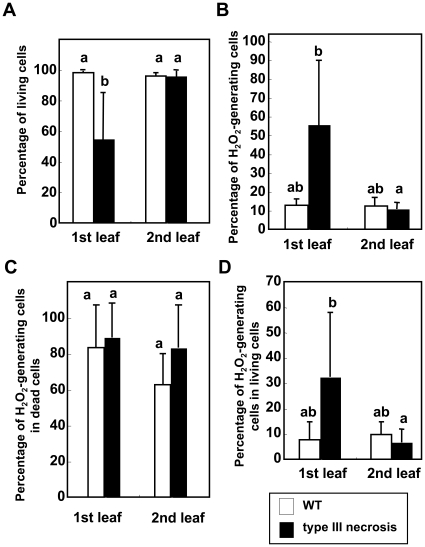
Figure 6. Relationship between cell death and ROS generation revealed by TEM observations.
Mesophyll cells of the 1st (lowest) and 2nd leaves were compared for synthetic hexaploid wheat lines showing WT and type III necrosis. Means ± standard errors were calculated from data in three experiments. Mean values with the same letters were not significantly different (P>0.05) (Turkey-Kramer's HSD test). A) Percentage of observed living mesophyll cells. B) Percentage of observed mesophyll cells with ROS generation. C) Percentage of dead cells with ROS generation. D) Percentage of living cells with ROS generation.

