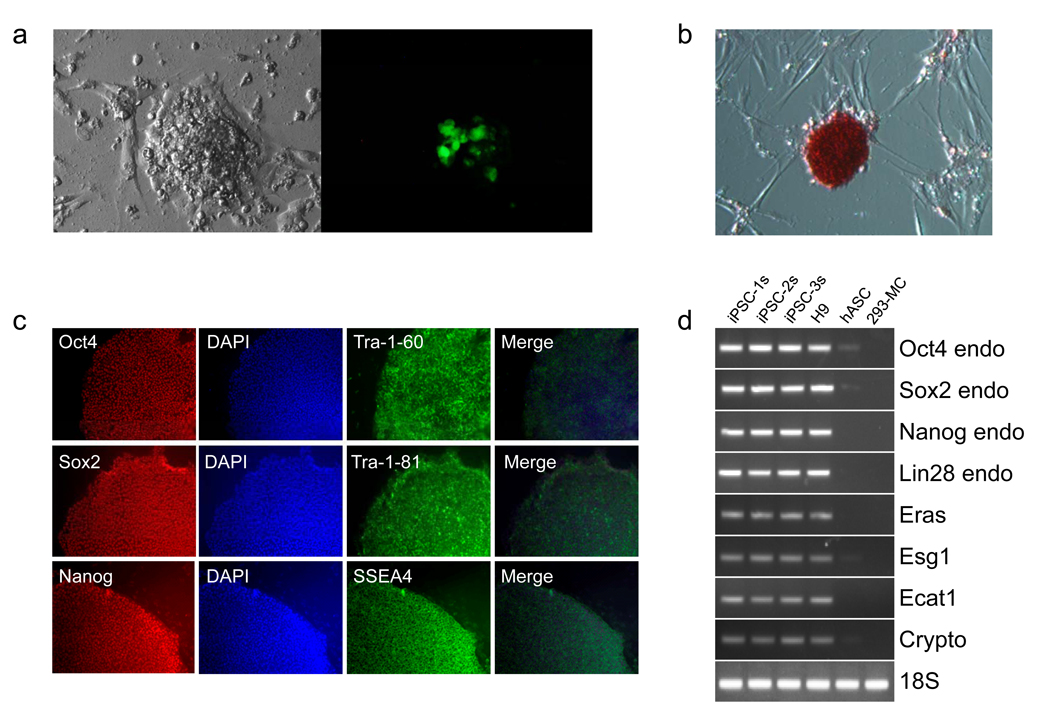
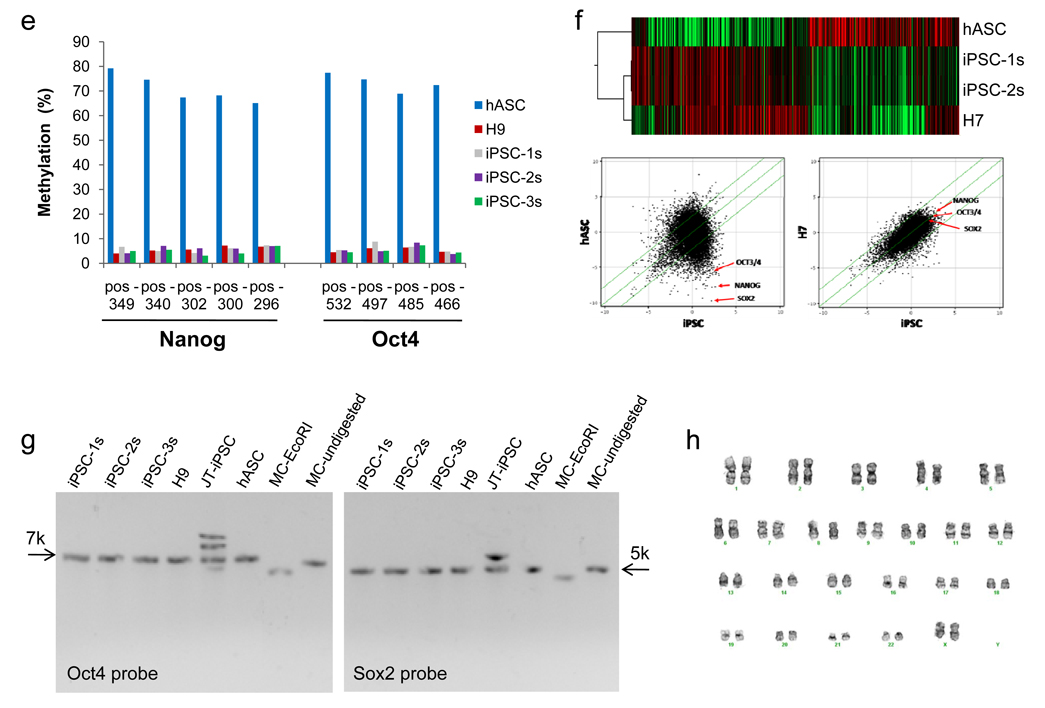
Figure 1. Generation of iPS cells with minicircle vector.
a, Representative day 18 cluster of mc-iPS cells. The cluster shown here exhibited transgene expression, as seen by GFP detection. GFP-negative colonies were isolated for further analysis. b, mc-iPS cells are positive for alkaline phosphatase, c, immunostain for common embryonic markers, and d, express embryonic genes, including reactivation of endogenous Oct4, Sox2, Nanog and Lin28. As negative control, 293FT cells were transfected with the minicircle vector (293-MC) but did not express the same endogenous genes. (Note: H9 is the H9 human ES cell line. iPSC-1s denotes a mc-iPS cell colony subclone derived from Donor 1, iPSC-2s subclone from Donor 2, etc). e, Bisulfate sequencing shows hypomethylation within the promoters of Oct4 and Nanog in the three mc-iPS cell subclones. f, Microarray data. Upper panel, heat map showing two mc-iPS cell subclones are similar to H7 human ES cells and distinct from hASCs. Lower panel, scatter plots highlighting Oct3/4, Sox2, and Nanog expression (red arrows). Green lines indicate 5-fold changes in expression levels between paired samples (iPSC represents the average of both subclones). g, Southern blot analysis of genomic DNA confirms that mc-iPS subclones are transgene free, as determined by the number of copies of Oct4 and Sox2. As positive control, lentivirallyreprogrammed iPS cells from the James Thomson lab (JT-iPSC) exhibited multiple bands for each of the two genes. h, mc-iPS cells (passage 5) had normal diploid karyotype.


