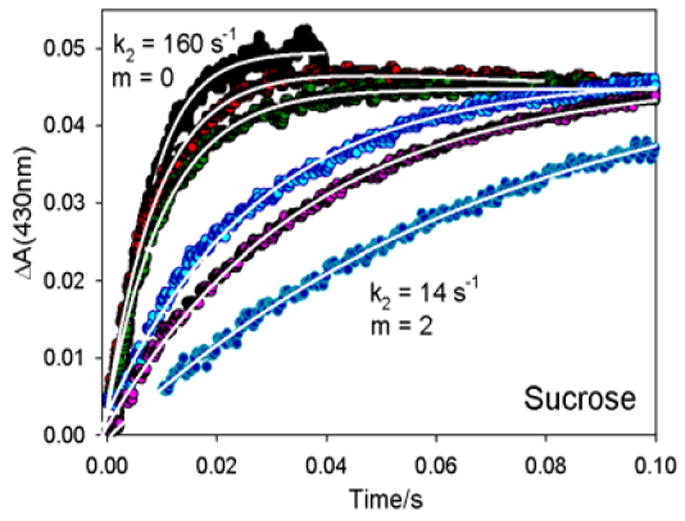
Figure 2.

Stopped-flow oxidation of Fered within [Fered(MgATP)2: MoFe] complex. Sucrose concentrations vary from 0 to 2 m. Traces for m = 0 in H2O and D2O overlay so that the latter would barely be visible if shown, and hence is not (traces have same k2 within error). Conditions: 75 μM Fe protein, 20 μM MoFe protein; 100 mM HEPES buffer, pH 7.4: 25 C.
