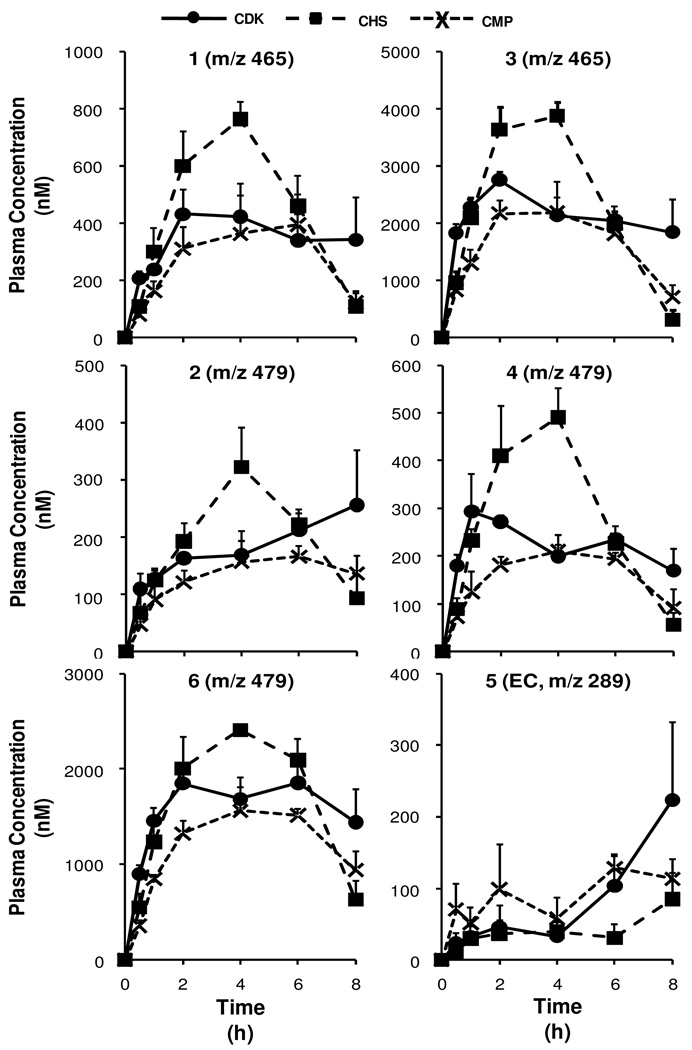
Figure 4.
Plasma pharmacokinetic curves (0–8 h) of native flavan-3-ols and predominant phase-II metabolites (glucuronides and O-Me glucuronides) from rats fed each of the chocolate confections. Peak 1: (±)-C/EC-O-glucuronide, peak 2: O-Me-(±)-C/EC-O-glucuronide, peak 3: (±)-C/EC-O-glucuronide, peak 4: O-Me-(±)-C/EC-O-glucuronide, peak 5: (±)-EC, peak 6: O-Me-(±)-C/EC-O-glucuronide. Curve values represent the mean plasma concentration from n=4 rats per time point for each treatment; error bars represent the SEM. Plasma concentrations are expressed as EC equivalents. Note the distinct scales for each set of curves.

