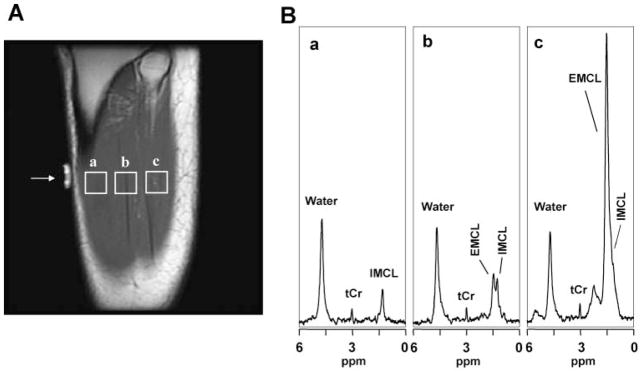
Figure 3.
Representative SV-MRS data of the TA muscle of a lean subject: (A) T1-weighted MR images showing voxels selected in calf muscle regions with (a) no visible intermuscular adipose tissue, (b) minimal visible adipose tissue, and (c) large amount of visible intermuscular adipose tissue. (B) Spectral data from voxels corresponding to those depicted in (A), consisting of resonances for IMCL (1.28 ppm), EMCL (1.50 ppm), and tCr (3.0 ppm). The spectra depicted in (a), (b) and (c) cover the range of spectral patterns observed in this study: (a) IMCL, resonance only, which was uncommon, (b) resolved IMCL and EMCL resonances, which was typical, and (c) a case of severe overlap of the IMCL resonance by that of EMCL.

