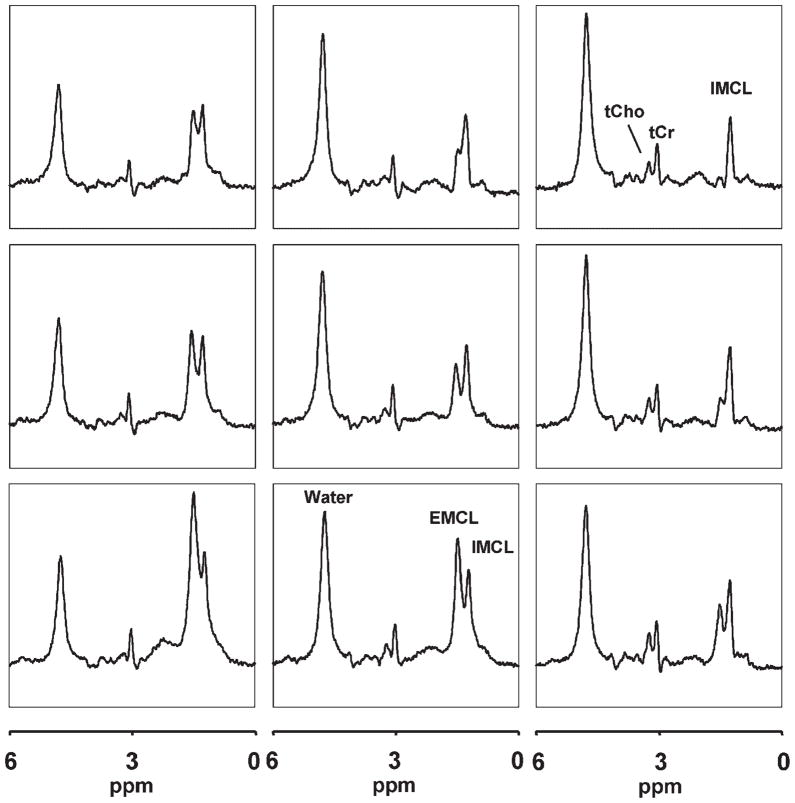
Figure 4.
Representative 1H MRSI data of the same TA muscle as in Fig. 3, showing the spatial distribution of IMCL, EMC, and tCr in a 3 × 3 grid of voxels. Note well-resolved IMCL and EMCL resonances in most voxels, and substantial variations in the intensity of EMCL, whereas those of IMCL and tCr remain relatively constant spatially.

