Figure 5.
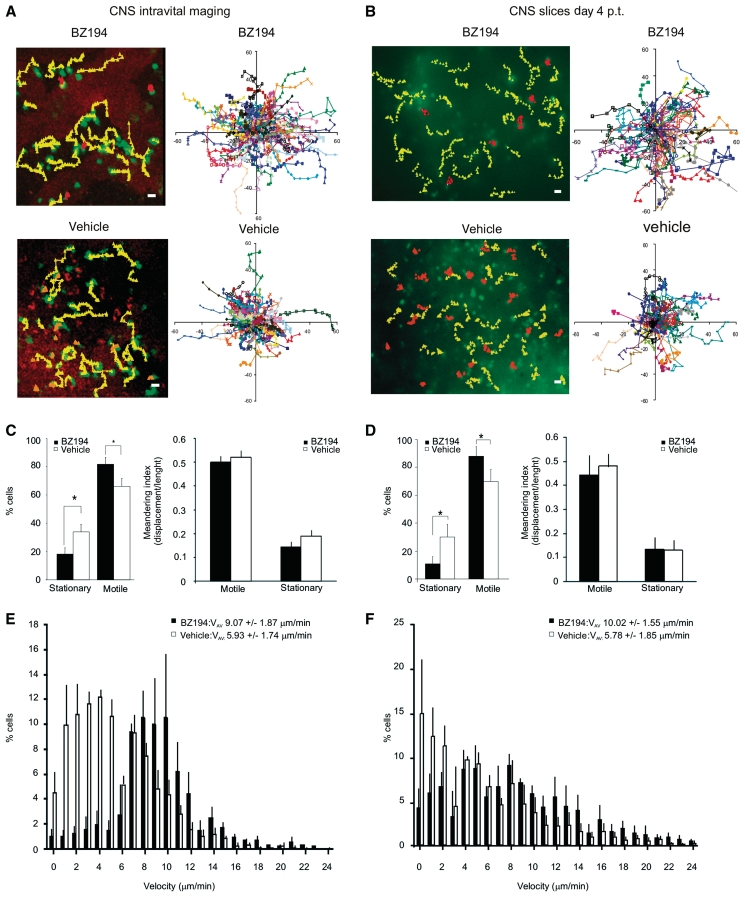
BZ194 increases effector T cell motility within EAE lesions. The locomotion patterns of TMBP-GFP cells in EAE lesions at Day 4 p.t. were analysed in real time within the spinal cord using intravital two-photon laser scanning microscopy (A, C and E), or within spinal cord explants using two-photon laser scanning microscopy or video fluorescence microscopy (B, D and F). (A and B, left panels) The trajectories of representative stationary (orange) and motile (yellow) TMBP-GFP cells in BZ194-treated (upper panels) or vehicle-treated (lower panels) animals are shown: (A) intravital imaging; (B) spinal cord explant analyses (B); motile cells: displacements >10 µm/10 min; stationary cells: displacements <10 µm/10 min. Magnification bar = 10 µm. (A and B, right panels) Superimposed trajectories are shown. Each coloured line represents one cell. (A) Intravital analyses: two representative two-photon laser scanning microscopy movies comprising 88 (BZ194-treatment) and 85 (vehicle-treatment) TMBP-GFP cells are shown. (B) Spinal cord explants: two representative video microscopy recordings including 52 (BZ194) and 50 (vehicle) TMBP-GFP cells are shown. (C and D) Characterization of motile and stationary cells. (C and D, left panels) Quantifications of motile and stationary TMBP-GFP cells in BZ194-treated (black) versus vehicle-treated (white) animals. Data from intravital analyses represent mean values ± SD of three independent movies including 255 cells and 16 065 time intervals per treatment (C); explant video microscopy data represent mean values ± SD of five independent movies including 304 cells and 31 920 time intervals per treatment (D). *P ≤ 0.05. (C and D, right panels) The graphs show the meandering indices of TMBP-GFP cells of BZ194-treated or vehicle-treated animals. The meandering index is calculated as total cell displacement divided by the path length of a cell track. Intravital analyses: 340 cells in BZ194- and 223 cells in vehicle-treated animals were analysed. Values represent means ± SD from three independent movies/treatment. Spinal cord explant analyses: 154 cells in BZ194-treated and 228 cells in vehicle-treated animals were analysed. Mean values ± SD from five independent movies/treatments, including three video-microscopy movies and two two-photon laser scanning microscopy recordings are shown. (E and F) Instantaneous velocities of TMBP-GFP cells in the EAE lesions. (E) Intravital imaging: velocities of TMBP-GFP cells in BZ194-treated (black bars; total 340 cells; 8160 time points) or vehicle-treated (white bars; total 223 cells; 5352 time points) animals are shown. Data represent means ± SD from three independent movies/treatment. (F) Instantaneous velocities of TMBP-GFP cells in spinal cord explants of BZ194-treated (black bars; total 154 cells; 3696 time points) or vehicle-treated (white bars; total 228 cells; 5472 time points) animals. Mean values ± SD from five independent movies/treatment including three video microscopy movies and two two-photon laser scanning microscopy recordings are depicted. Average velocities (VAV) are indicated.

