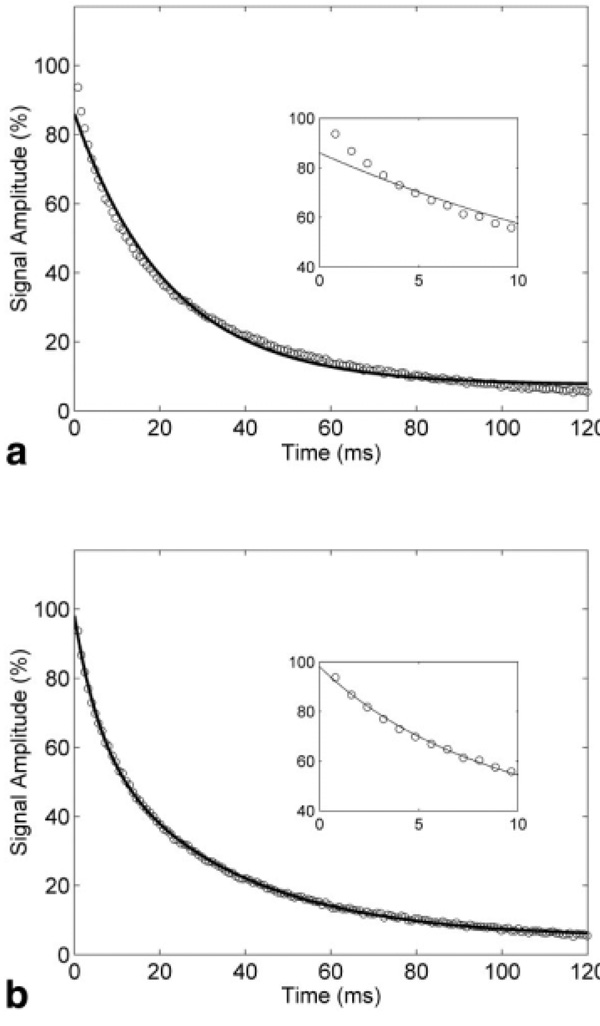
FIG. 5.
Signal decay curves for a typical CPMG experiment of liver specimen with τ = 0.4 ms. The inset shows the initial portion of the decay curve (0–10 ms time interval). The solid curves denote (a) monoexponential model fit and (b) biexponential model fit. The initial rapid decay component is apparent, which is not accounted for by the monoexponential model.

