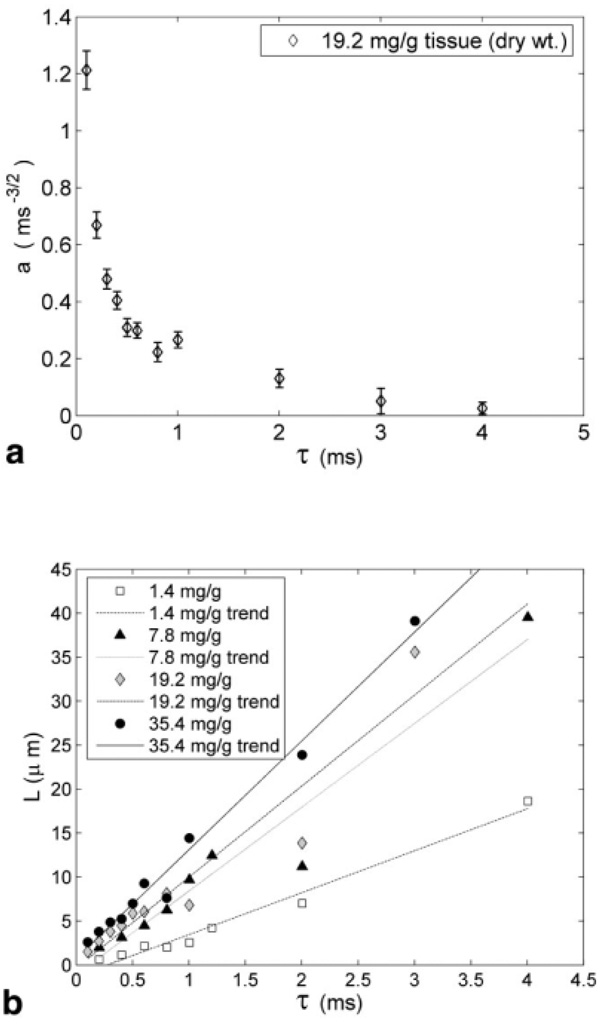
FIG. 7.
Results of the nonexponential model applied to CPMG data. (a) Variation of parameter “a”, reflecting spacing between iron clusters, with τ for a representative liver specimen. (b) This plot demonstrates an increase of the spacing between iron centers L (derived from “a”) with iron load as well as with τ. The vertical bars denote 95% confidence bounds in estimation of the model parameter “a.”

