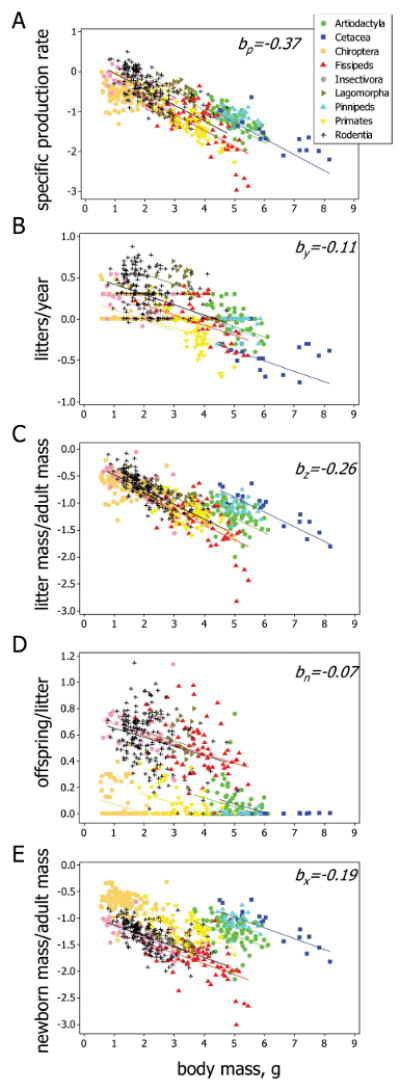
Figure 2.

Variation in productivity (A) and the components of reproduction (B–E) as a function of body size. Productivity is measured as specific production rate, y−1 defined as the product of (litter mass)/(adult mass) and litter frequency (litters per year). (Litter mass)/(adult mass) is the product of offspring per litter and (newborn mass)/(adult mass). All scales are logarithmic to base 10. Symbols as in A throughout. The lines in each panel have the same slopes and are color coded according to taxon. The regression coefficients (slopes) are shown at the top right of each panel. The four outlying data points for fissipeds to the right of A, C, and E are bears of the family Ursidae. For clarity, only taxonomic/lifestyle groups with ≥10 species are shown.
