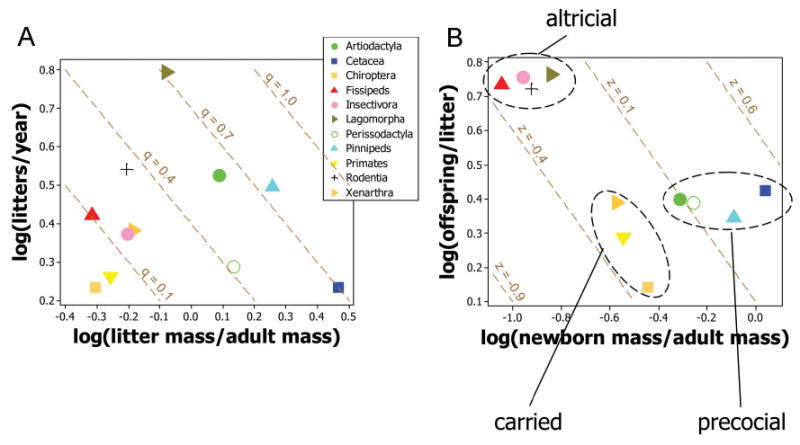
Figure 4.

Scatterplots analyzing the two trade-offs between number of litters per year and litter mass (A) and between number of offspring per litter and offspring size (B) by plotting the normalization constants of the main mammal taxonomic/lifestyle groups. Numerical values of normalization constants are given, together with their standard errors (which are generally <0.05) in table A1. Ellipses enclose the classes of mammalian life histories referred to in the text. A, Litters per year as a function of (litter mass)/(adult mass). Dashed brown lines connect strategies having the same values of specific production rate (q) and satisfy equation (6a). B, Offspring per litter as a function of (newborn mass)/(adult mass). Dashed brown lines indicate strategies with the same values of (litter mass)/(adult mass) (z) and satisfy equation (6b) (see fig. 3 for a rationale). Logarithms are to base 10.
