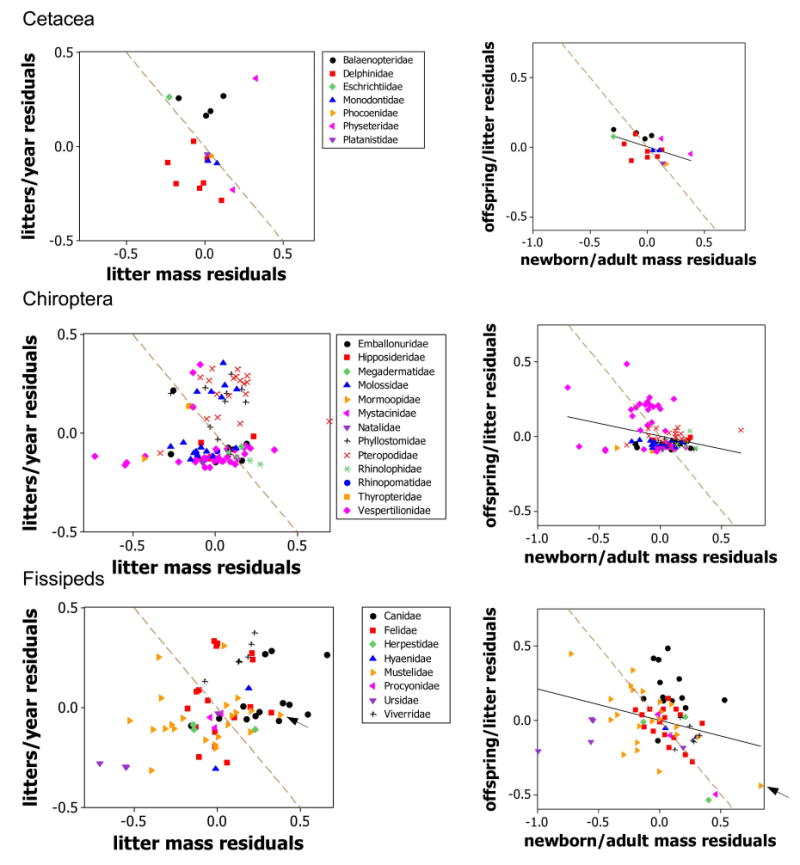
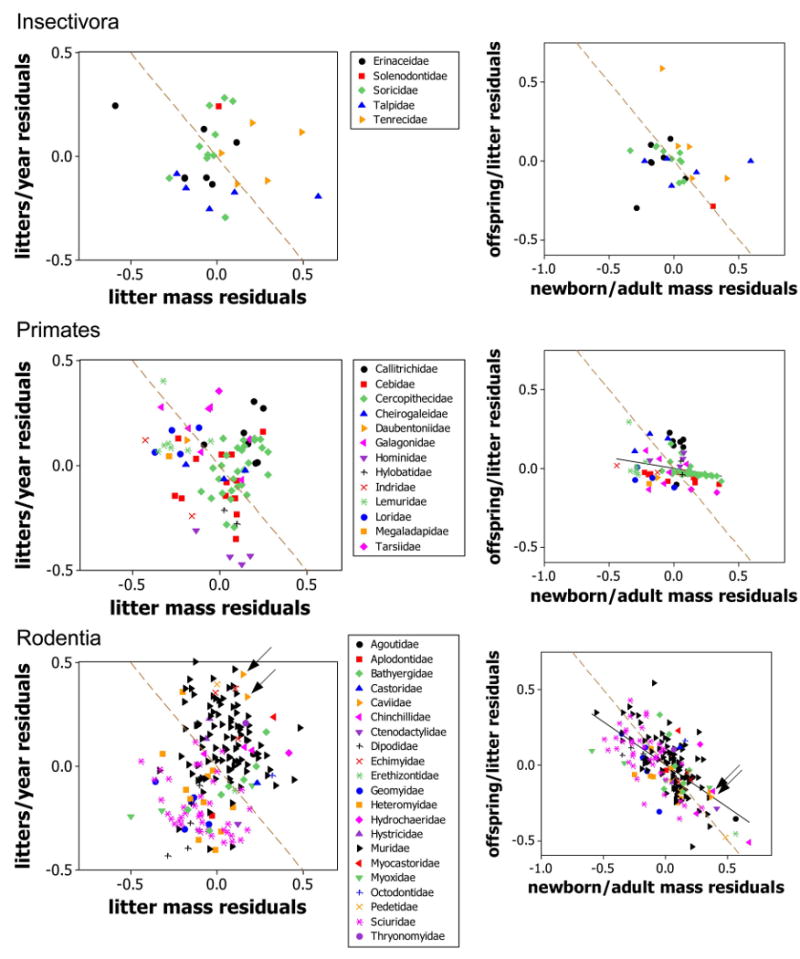
Figure A1.


Scatter diagrams like those in figure 5 for the taxonomic/lifestyle groups not shown in that figure. One point did not fit in the left-hand column, a bear (Fissipeds, Ursidae) with coordinates (−1.20, −0.03). Dashed brown lines connect strategies with the same value of the resource being allocated. Thus, the equation of the line in the left-hand panels is (z – z̄) + (y – ȳ) = 0; here (z – z̄) represents the residual of z and (y – ȳ) the residual of y. The line goes through the point (0, 0) because the mean of the residuals of each trait is 0. Similarly, the line in the right-hand panels has the equation (x – x̄) + (n – n̄) = 0. The caviomorphs are arrowed within the rodents and the sea otter within the fissipeds (see main text).
