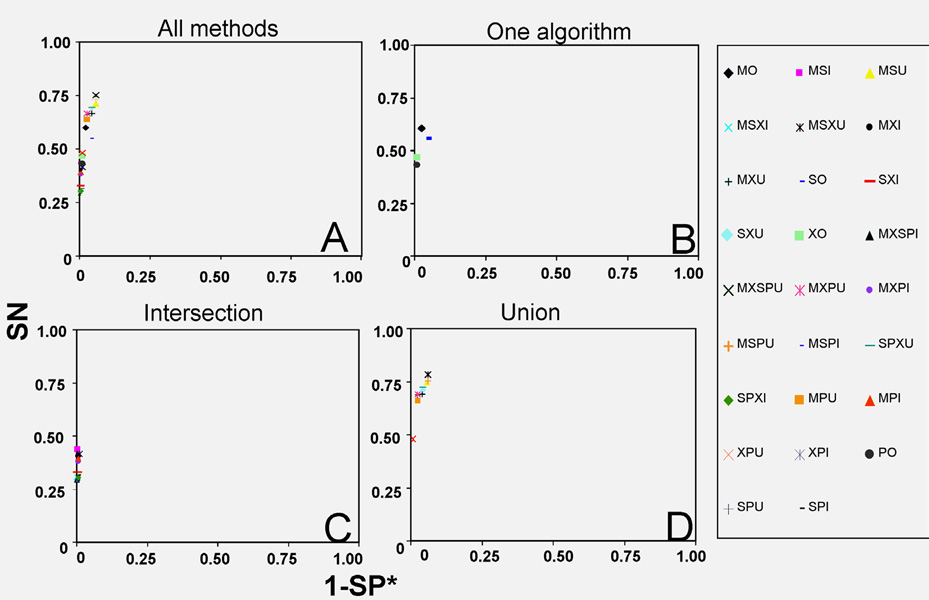
Figure 2.
ROC method plots of the average SN and SP* of all consensus methods. ROC method plots (SN vs. 1-SP*) of average of A) all consensus methods, B) individual (O), C) intersection (I), and D) union (U) consensus methods that employed a combination of the following search engines: Mascot (M), Sequest (S), X!Tandem (X) and Phenyx (P).

