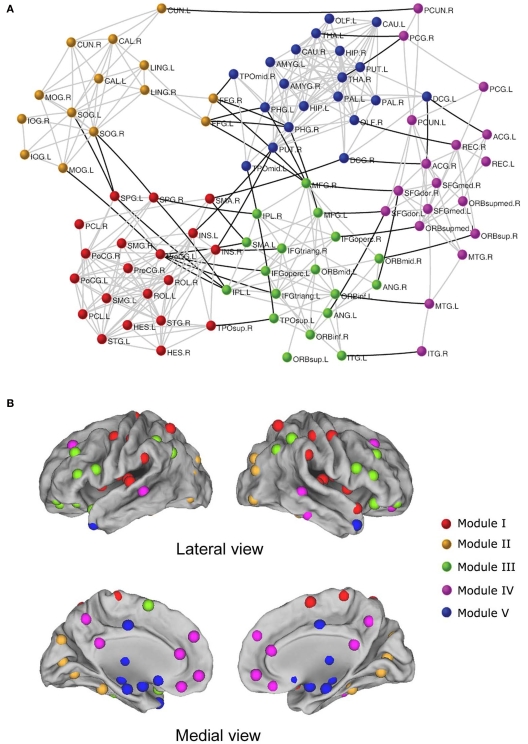
Figure 2.
The modular architecture of resting-state functional brain network (He et al., 2009b). (A) Five modules were identified in a functional network of the human brain, represented by five different colors. The geometric distance between brain regions on the drawing space approximates the shortest path length between them. The network is visualized with Pajek (http://vlado.fmf.uni-lj.si/pub/networks/pajek/). The intra-module and inter-module connections are shown in gray and dark lines, respectively. For the abbreviations of the regions, see He et al. (2009b). (B) Surface representation of modular architecture of a functional brain network. All 90 brain regions are marked by using different colored spheres (different colors represent distinct network modules) and further mapped onto the cortical surfaces in the lateral and medial views, respectively. Notably, the regions are located according to their centroid stereotaxic coordinates. For visualization purposes, the subcortical regions are projected to the medial cortical surface according to their y and z centroid stereotaxic coordinates.

