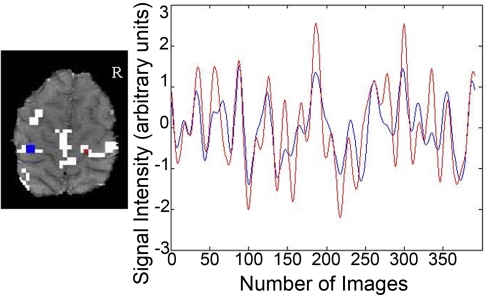
Figure 1.
Connectivity data from a representative participant. The seed region and corresponding time course for a single participant are depicted in blue. Voxels having correlation strength above threshold are shown in white. The time course for a suprathreshold voxel and the corresponding voxel are shown in red.

