
Fig. 3.
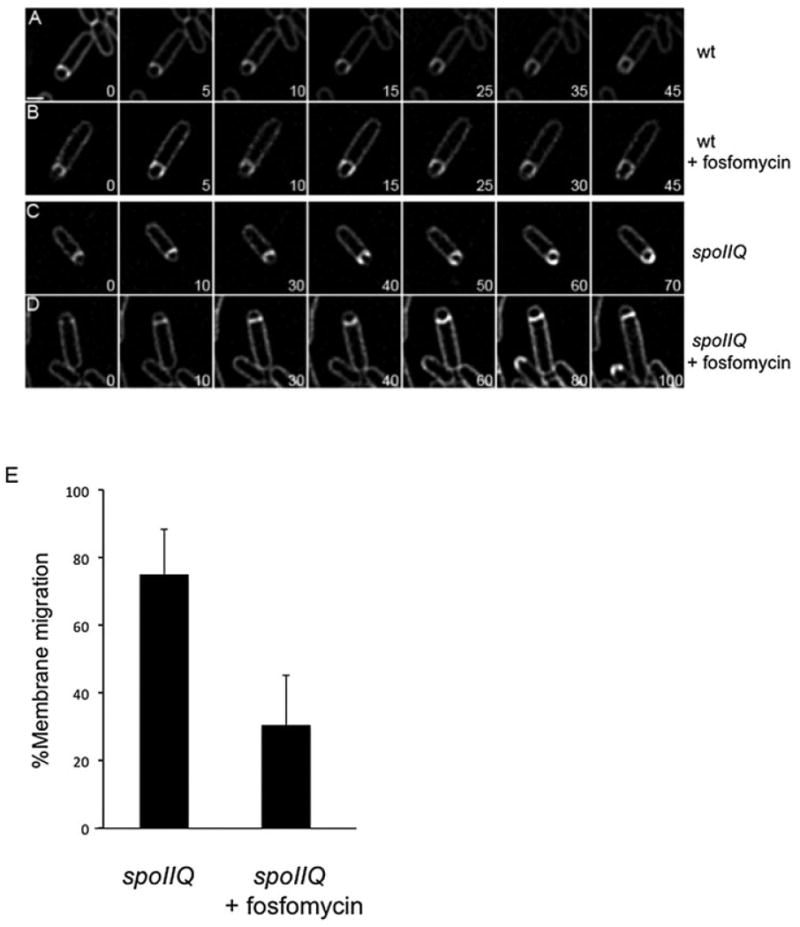
Inhibition of muropeptide synthesis blocks membrane migration in a spoIIQ mutant. All cultures were grown on agarose pads composed of A+B medium at 30°C and stained with FM4-64. The initial image in each sequence was taken at approximately T2 after sporulation initiation and arbitrarily set to t = 0 min. The time of subsequent images of the membrane stain is indicated in minutes in the lower right corner.
A. Wild type (PY79).
B. Wild type + 5 mM fosfomycin added at T1.5 after initiation of sporulation.
C. spoIIQ (KP575).
D. spoIIQ + 5 mM fosfomycin added at T1.5.
E. Histogram showing the percentage of cells where membrane migrated in ΔspoIIQ cells with (17 out of 55 cells or 75 ± 5%) or without (54 out of 72 cells or 30 ± 6%) 5 mM fosfomycin added at T1.5 after initiation of sporulation. Means are significantly different by t-test (P < 10−5). For complete movies, see Fig. S3. Scale bar = 1 μm.