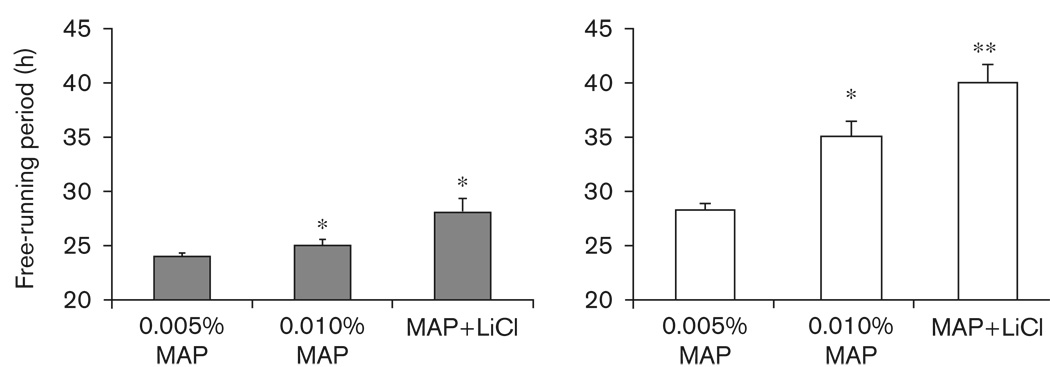
Fig. 5.
Average±SEM τ observed when mice were treated with 0.005% methamphetamine (MAP), 0.010% MAP, or a combination of 0.005% MAP and lithium chloride (LiCl) (MAP + LiCl). All drug treatments resulted in longer τs compared with control conditions (data not shown). The gray bars are data from animals housed in constant darkness; open bars are data from animals housed in constant light. *Significantly longer than 0.005% MAP, **Significantly longer than 0.005 and 0.010% MAP.

