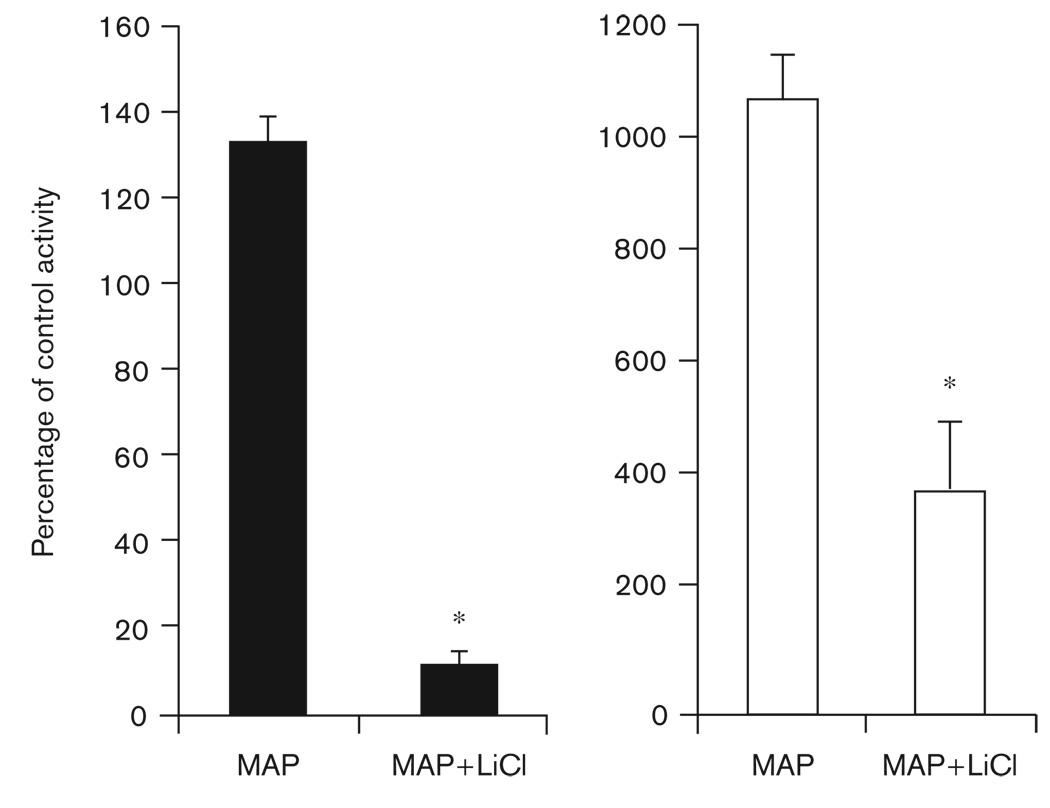
Fig. 6.
Average±SEM activity levels on 0.005% methamphetamine (MAP) alone and on 0.005% MAP with lithium chloride (LiCl) (MAP + LiCl). Data are presented as a percentage of control conditions (where control activity level=100%). The black bars represent data from mice housed in constant darkness (DD), the open bars are data from mice housed in constant light (LL). *Significant difference from 0.005% MAP (P<0.01). Note the difference in scale between the DD and LL charts.

