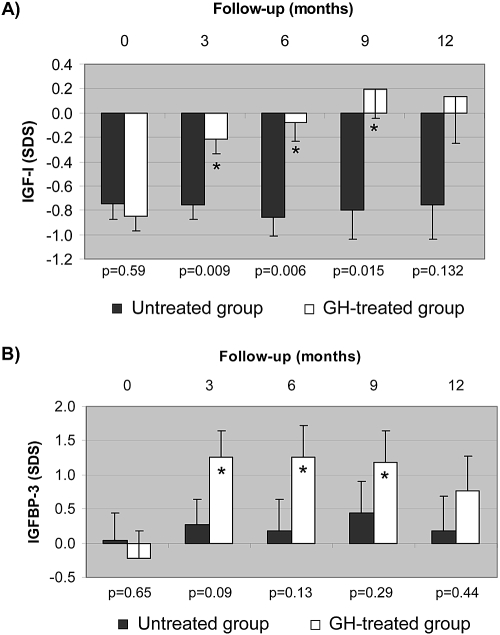
Figure 3.
(A and B) Evolution of IGF-I (A) and IGFBP-3 (B) during the 1-year study period in the two groups of infants with CRF. ■, Untreated group; □, GH-treated group. Data are means ± SEM of SDS for reference values. P values of intergroup comparisons at that particular time point. *Intragroup significant change compared with the corresponding baseline (Bonferroni adjusted P < 0.05).

