
Figure 6.
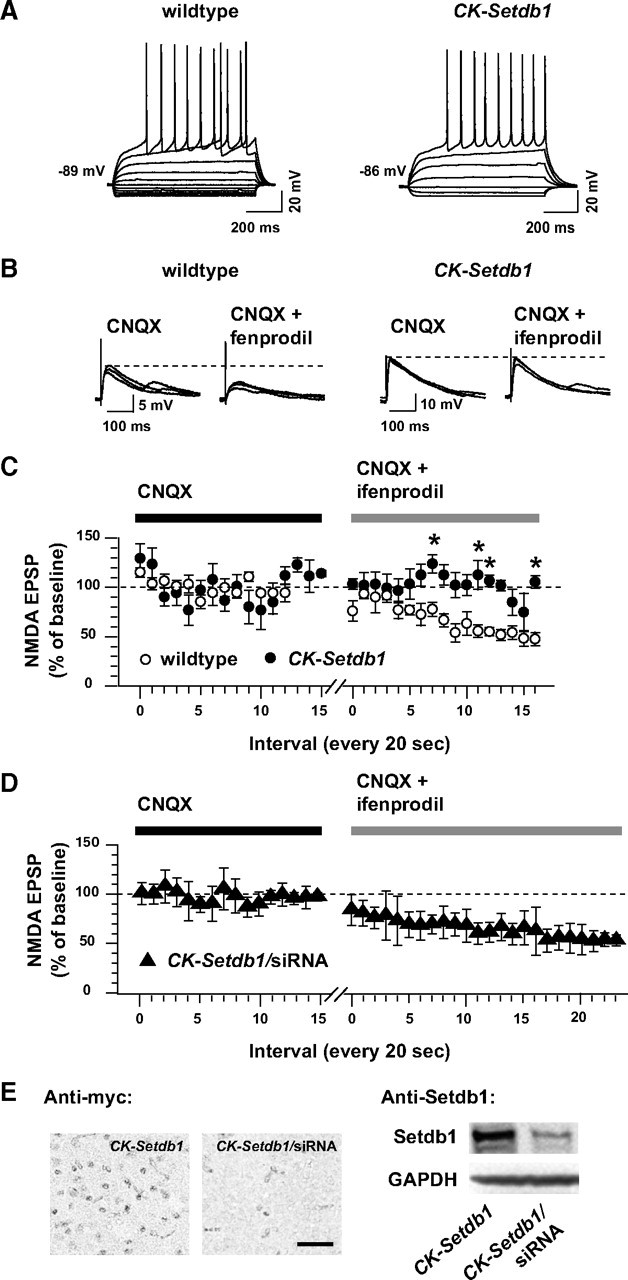
Ifenprodil-mediated inhibition of NMDA EPSPs in CK-Setdb1 and wild-type MSNs. A, Current–voltage (I–V) relationship of representative nucleus accumbens/ventral striatum neurons from wild-type and CK-Setdb1 mice recorded in whole-cell patch clamp in a slice of tissue. Notice the strong rectification in the hyperpolarizing range, the large action potential overshoot, presence of a ramp, and hyperpolarized resting potential (approximately −87 mV) that identify these neurons as MSNs. B, Representative NMDA EPSPs from wild-type and transgenic neurons, recorded at resting membrane potential before (10 μm CNQX) and during ifenprodil perfusion (10 μm CNQX + 100 μm ifenprodil). Notice that the NMDA-EPSP amplitude remained unchanged in CK-Setdb1 neuron after ifenprodil exposure. C, Mean amplitudes of NMDA EPSPs evoked every 20 s before (CNQX) and during ifenprodil exposure (CNQX + ifenprodil) in slices from wild-type (open circles) and CK-Setdb1 mice (filled circles). EPSPs were evoked in an Mg2+-free ACSF, and their amplitudes were expressed as a percentage of baseline (CNQX). Data (mean ± SEM) are shown for four transgenic and five wild-type neurons (animals). A fifth CK-Setdb1 neuron was removed as an outlier (Grubbs' test; two-way ANOVA, genotype, F (1,6) = 105.2; p < 0.001). *p < 0.05 (Newman–Keuls post hoc test). D, Same recording as in C but from CK-Setdb1 mice treated with Setdb1-siRNA (filled triangles). n = 4 neurons. Notice that in C, wild-type but not CK-Setdb1 neurons show reduced NMDA EPSPs from baseline (dotted line) in the presence of ifenprodil. Notice also that in D, siRNA treatment restores NMDA-EPSP sensitivity to ifenprodil in CK-Setdb1 neurons. E, Representative examples of anti-myc immunohistochemistry (left) and anti-Setdb1 immunoblots (right) from the ventral striatum of untreated and Setdb1-siRNA-treated CK-Setdb1 mice. Scale bar, 100 μm. Notice the robust decrease of myc and Setdb1 immunoreactivity after siRNA treatment. Data in D and E are from brains harvested 60 h after siRNA delivery into striatum.