
Figure 1.
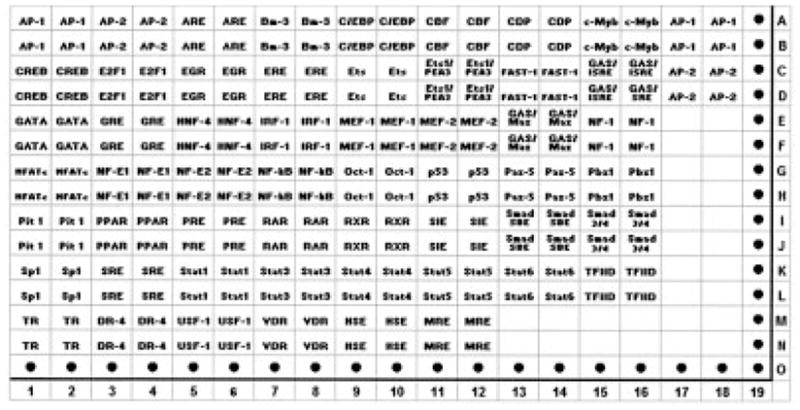
Schematic diagram of TransSignal protein–DNA array. The genes on the array are spotted in duplicate (the first row of each is DNA spotted at a standard concentration and the second row of each is DNA diluted 1:10).
Official websites use .gov
A
.gov website belongs to an official
government organization in the United States.
Secure .gov websites use HTTPS
A lock (
) or https:// means you've safely
connected to the .gov website. Share sensitive
information only on official, secure websites.
Schematic diagram of TransSignal protein–DNA array. The genes on the array are spotted in duplicate (the first row of each is DNA spotted at a standard concentration and the second row of each is DNA diluted 1:10).