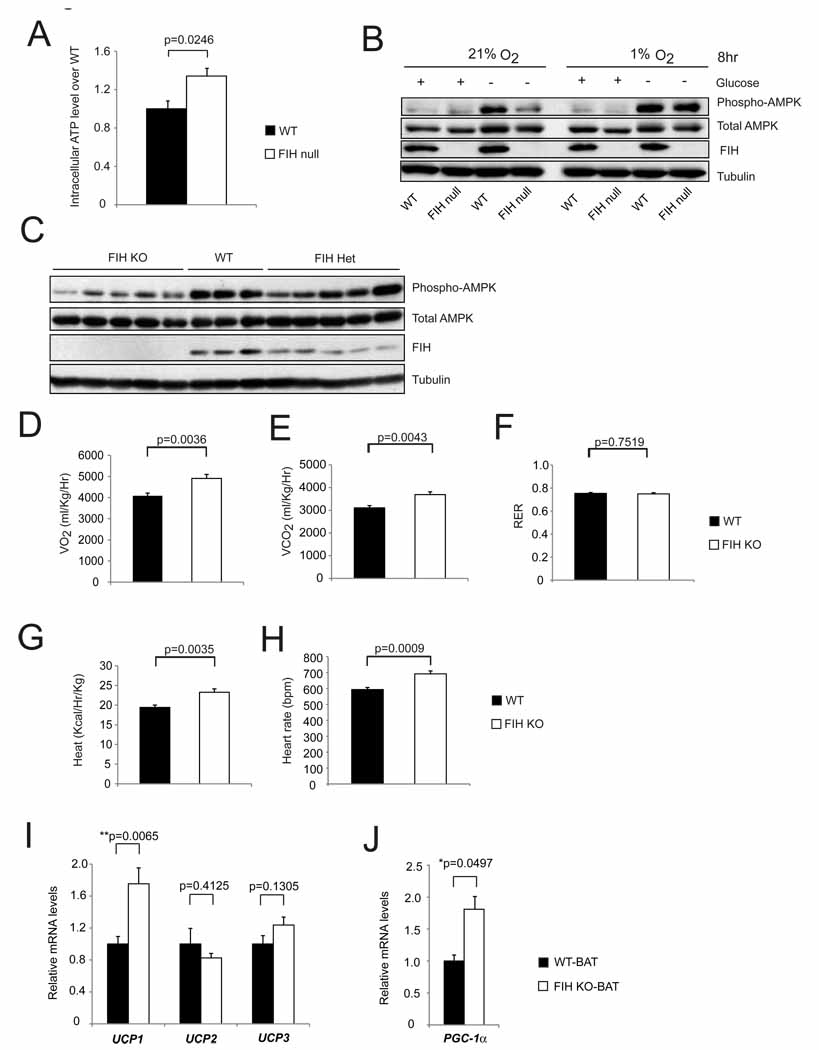
Intracellular ATP levels in primary WT and FIH null MEFs under normoxia (n=3/group).
Levels of phospho-AMPK and total AMPK were measured by immunoblotting with whole cell lysates from primary WT and FIH null MEFs treated with conditions as indicated.
Immunoblotting analysis of whole cell lysates from E12.5 WT (n=3), FIH Het (n=5) and FIH KO (n=5) embryos using phospho-AMPK, total AMPK, FIH and tubulin antibodies.
Resting whole-body O2 consumption (VO2) in 2-month old WT (n=7) and FIH KO (n=5) mice. Shown are the average value over 3 hr.
Resting CO2 production (VCO2) in the same mice as in (D).
RER (respiratory exchange ratio) were determined during the same period as in (D).
Heat production was determined during the same measurement as in (D).
Heart rates were measured in resting 2-month old WT (n=9) and FIH KO (n=5) mice under normoxic condition.
UCP1, UCP2 and UCP3 mRNA levels in brown adipose tissue (BAT) from 5-month old mice under normal chow were measured by qPCR (n=6/genotype).
-
PGC-1α mRNA levels in BAT from 5-month old mice under normal chow were measured by qPCR (n=6/genotype).
For gene expression analysis in (I) and (J), specific primers for β-actin were used for normalization.
Values shown in graphs are expressed as mean ± SEM. p values are from Student’s t-test.

