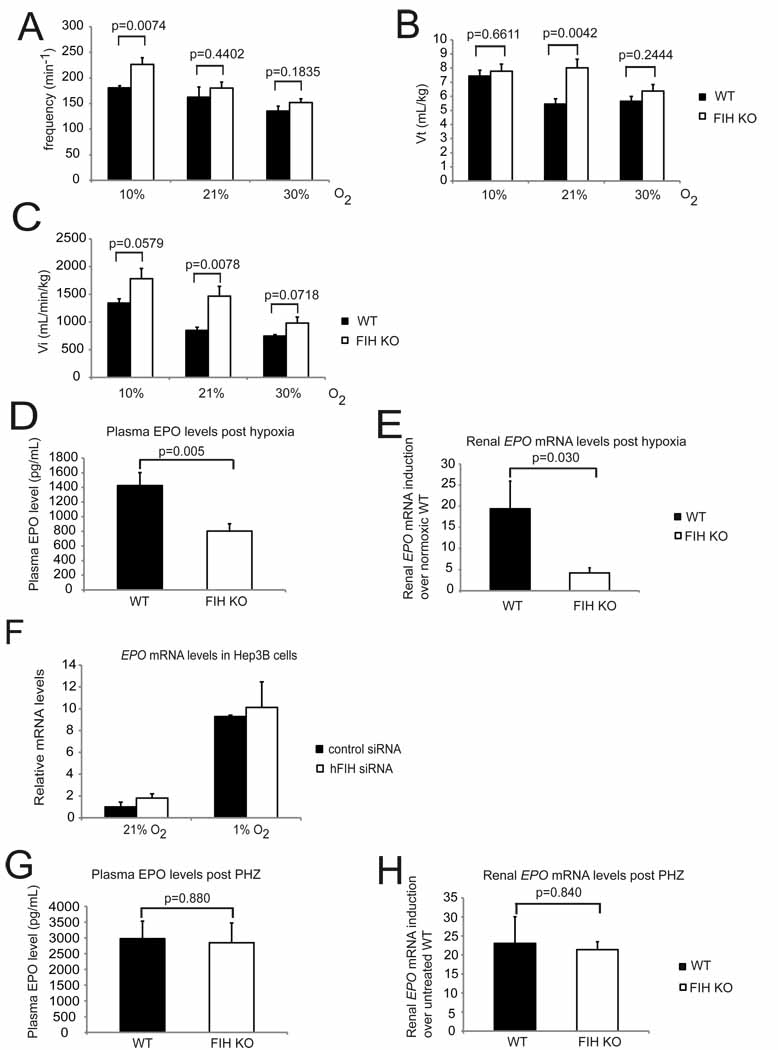
Respiration frequencies of unrestrained WT (n=7) and FIH KO (n=8) mice under acute hypoxia (10% O2), room air (21% O2), and hyperoxia (30% O2) were measured using barometric pressure plethysmography.
Tidal volume (Vt) was measured in the same assay as in (A).
Inspired minute ventilation (Vi) was determined in the same assay as in (A).
Plasma EPO levels in WT and FIH KO mice following acute hypoxic exposure at 9% O2 for 14 hours (n=15/genotype).
Analysis of renal EPO mRNA levels in hypoxia-treated WT (n=7) and FIH KO (n=8) mice (9% O2, 14 hr) by qPCR. Kidneys were collected immediately after hypoxia treatment, fast frozen in liquid N2 and stored at −80°C before RNA isolation.
Representative qPCR analysis of mRNA levels for EPO in Hep3B cells following control or hFIH siRNA treatment. Cells were cultured under normoxic or hypoxic conditions for 16 hr before harvest (n=3/condition).
Plasma EPO levels in WT (n=6) and FIH KO (n=5) mice after overnight PHZ treatment.
-
qPCR analysis of renal EPO expression in PHZ-treated mice (same as those in (G)).
Results in (E), (F) and (H) were normalized to β-actin.
Values shown in graphs are expressed as mean ± SEM. p values are from Student’s t-test.

