
Figure 2.
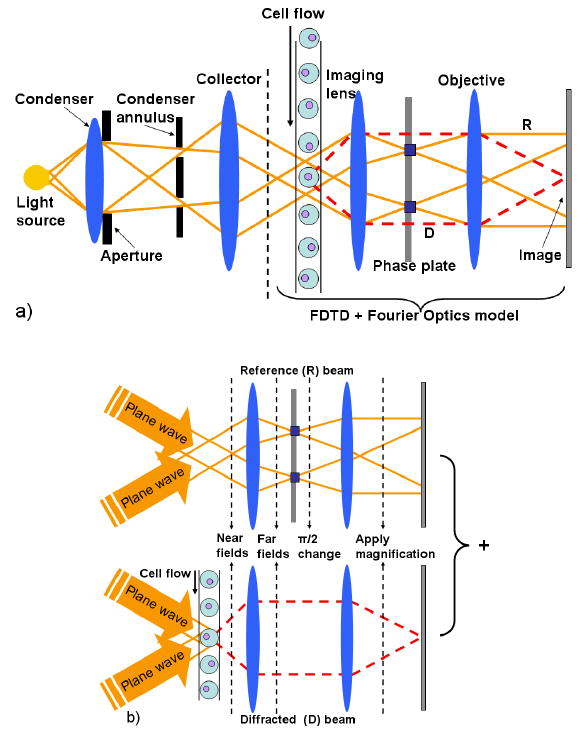
a) Schematic representation of an OPCM cytometer. b) 2D visual representation of the FDTD OPCM model using incoherent illumination by two planes waves at a polar angle of 30 deg. For each of the two plane waves the propagation of light is modeled as a combination of two parallel wave phenomena: i) propagation of the reference (R) beam without the cell flow, and ii) propagation of the diffracted (D) beam due to one particular cell of the cell flow.