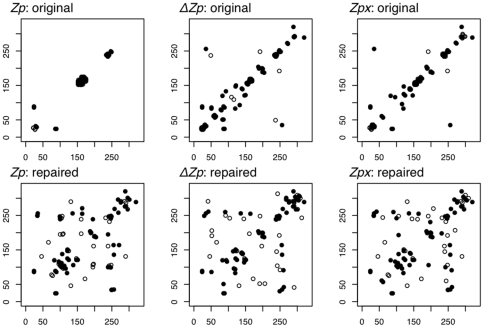
Figure 5. Predicted contact map shows repaired cd00300 alignment is more informative than the original.
The top 50 highest Zp,  , and Zpx values were plotted on the 2-D map of the original cd00300 alignment (top) which contains systematic misalignments and the repaired version of cd00300 (bottom) with many misalignments removed. The data is displayed as a predicted contact map where black-filled circles are pairs in contact and white-filled circles are pairs not in contact. The majority of high-scoring Zp pairs in the original alignment are uninformative local contacts located in a major region of misalignment (top left). The contact maps of
  and Zpx cover much more of secondary and tertiary structure in both the original and repaired alignments.

