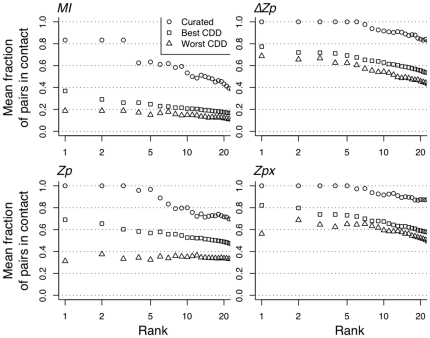
Figure 6. The effect of alignment quality on contact identification.
All methods identify many contacts in the curated dataset. Plotted here is the mean fraction of pairs in contact of the top  ranked pairs (up to 20) for the Curated, Best CDD, and Worst CDD datasets using MI, Zp,
  , and Zpx. The Curated dataset contains ideal alignments that are hand-curated for accuracy. Best CDD contains alignments which are unlikely to contain systematic misalignments. Worst CDD contains alignments which are likely to contain systematic misalignments. Only pairs 10 or more positions apart in sequence are included to prevent proximity in sequence from biasing results.

