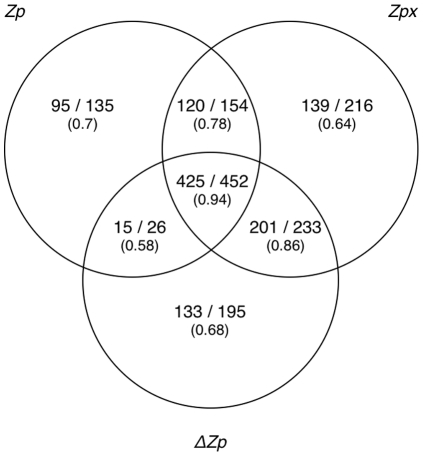
Figure 7. Zp, ΔZp, and Zpx find different subsets of contacting positions.
Venn diagram of pairs identified at 80% contact likelihood cutoff shown as number in contact vs. total predictions. Only pairs 10 residues or more apart in sequence were considered to prevent proximity in sequence from biasing results.

