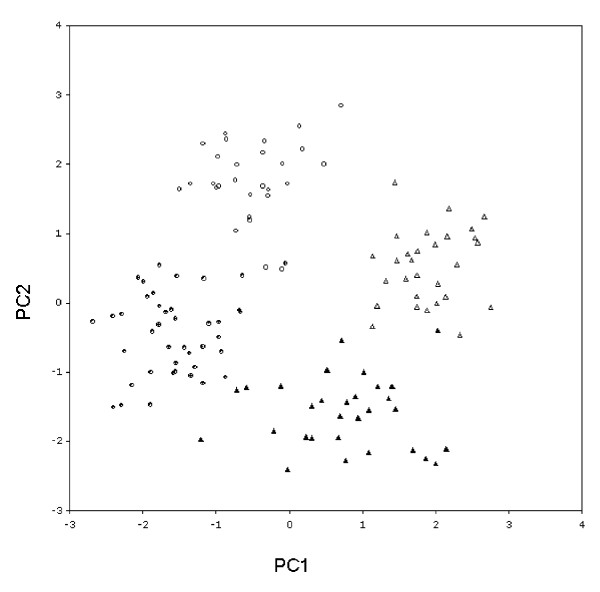
Figure 3.
Principal component analysis of the first (PC1) and second (PC2) components showing discrete clustering of Zimbabwe field collected G. m. morsitans (circle) and laboratory reared flies (triangle) demonstrating distinct population genotypes and robust within population separation of male (hollow shape) and female (filled shape) tsetse. AFLP bands from 129 individual insects using seven primer pair combinations (see Table 2) comprising 597 AFLP bands were analyzed.

