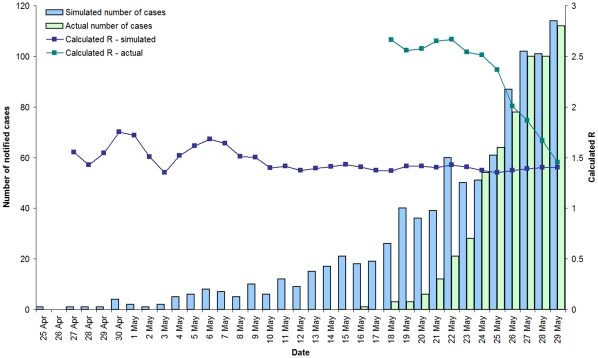
Figure 2. Actual and simulated cases and calculated R, Victoria, 25 April to 29 May 2009.
An example of simulated data, calculated with an effective reproductive number (R) of 1.4 and a mean serial interval of 2.8 days, compared with observed data 25 April to 29 May, Victoria 2009. Also shown is R calculated from the observed data using a serial interval of 2.8 days.

