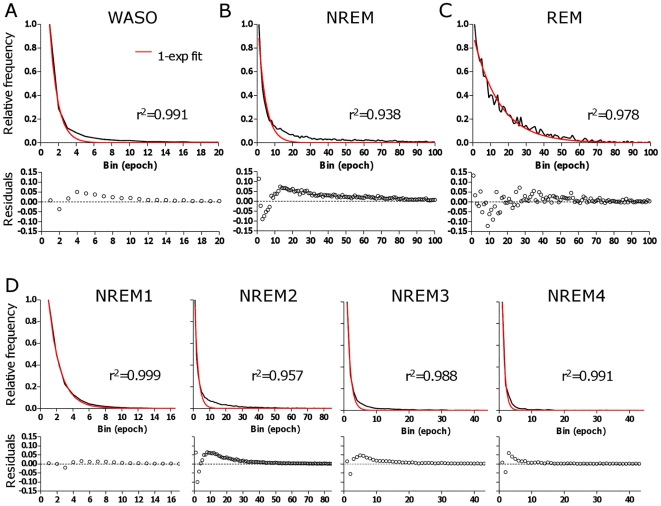
Figure 1. Frequency histogram analysis of bout durations in the control group.
The relative frequency of bouts in the control group is plotted against the duration of bouts (in bins of 30-second increments on the x-axis) for WASO (A), NREM (B), REM sleep (C) and sub-stages of NREM sleep (D) bouts. In each panel, the best fit single-exponential function (red) is overlaid, and the residuals (difference between data and fit) are plotted beneath each histogram.

