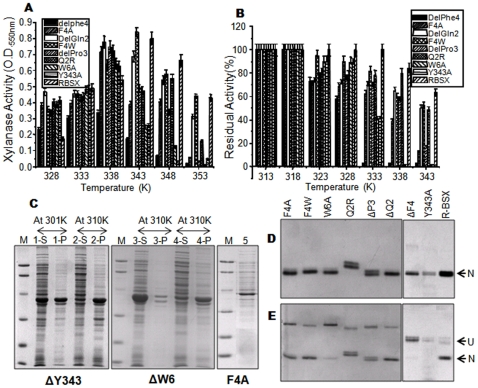
Figure 3. Activity, expression and native PAGE profiles of various mutants.
(A) Xylanase activity profile of R-BSX mutants at various temperatures. All of the mutants except for F4W showed maximal activity at 338K. F4W showed optimal activity at 343K, similar to R-BSX. (B) Lanes 1 (S &P) and 2 (S&P) show the expression profile of ΔY343 at 301K and 310K, respectively. Lanes 3 (S &P) and 4 (S&P) show the expression profile of ΔW6 at 301K and 310K, respectively. Lane 5 shows the reduced expression level of F4A at 310K. “S” and “P” denote the soluble and pellet fraction after sonication. (C) Thermostability of R-BSX and its mutants. Samples were incubated for 15 min at various temperatures and assayed for residual xylanase activity at their respective optimal temperatures. (D) and (E) show native-PAGE profiles of thermal unfolding of protein samples at room temperature and at 343K, respectively. “N” & “U” denote the native and unfolded conformations, respectively. ΔF4, ΔW6 and W6A unfolded completely after incubation at 343K for 15 min. Note the slow migration of the Q2R mutant on native PAGE, which indicates some local conformational changes.

