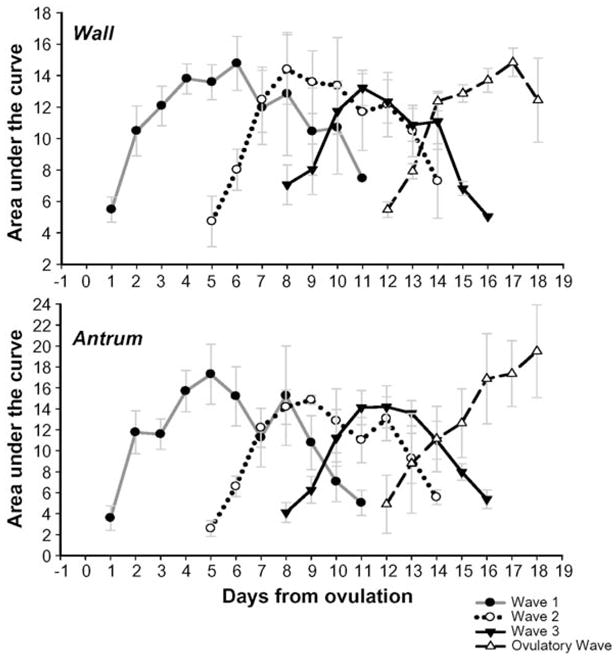
Fig. 4.

Changes in the mean (±SEM) area under the curve (AUC) for the follicular wall and antrum (top and bottom panels, respectively) for follicular waves during the interovulatory interval in normal cyclic ewes. Data are normalized to the corresponding mean day of wave emergence for each follicular wave after ovulation (Day 0).
