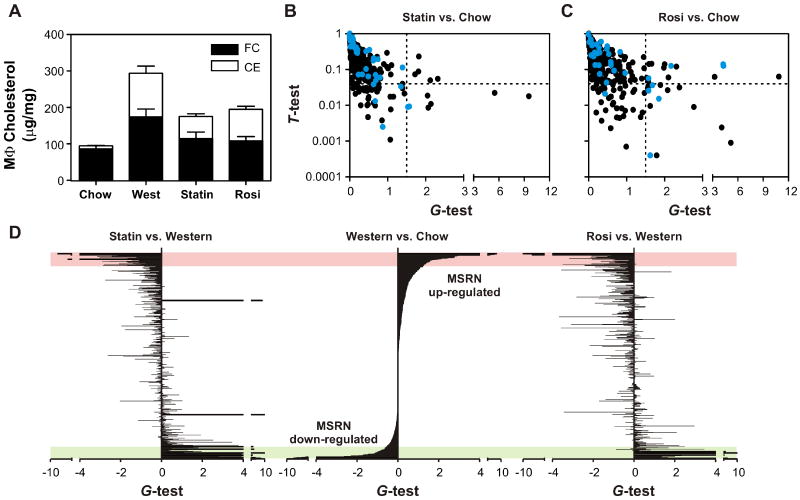
Figure 4. Impact of anti-atherosclerotic interventions on the MSRN.
Ldlr-/- mice were fed a Western diet for 14 weeks with or without simvastatin (Statin) or rosiglitazone (Rosi) for the final 2 weeks. Panel A: Macrophage (Mϕ) cholesterol levels; FC, free cholesterol; CE, cholesteryl ester. Results are means and standard deviations. Panels B,C: Differentially expressed proteins of macrophages isolated from Ldlr-/- mice fed a chow diet vs. simvastatin-treated (Panel B) or rosiglitazone-treated (Panel C) Ldlr-/- mice fed a Western diet. Proteins identified as differentially expressed by macrophages isolated from chow and Western diet-fed mice (Fig. 1e) are shown in blue. Panel D: Relative abundance of proteins detected in conditioned media of macrophages was assessed by the G-test. Results represent chow vs. Western diet (center axis), Western diet plus statin vs. Western diet (left axis), or Western diet plus rosiglitazone vs. Western diet (right axis). A positive or negative value for the G-test indicates an increased or decreased level of protein expression in the first sample relative to the second. Proteins in all panels are sorted in descending order based on G-test values of the Western vs. chow diets (center axis). Bars at the same vertical level correspond to the same protein. Red and green areas highlight proteins that reside in the MSRN. See also Table S1.

