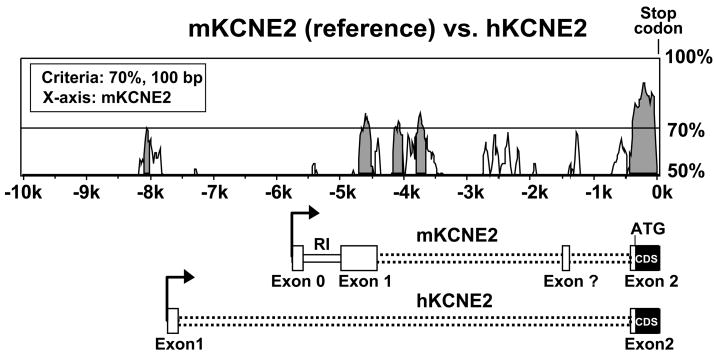
Figure 8.
Homology plot of the mouse and human KCNE2 genes upstream sequences (−10000 of the stop codon). Analysis was performed using Vista browser and LAGAN algorithm. Gray regions indicate conserved sequences with at least 70% homology in 100 bp segments, mKCNE2 considered as reference. Corresponding regions in the mouse KCNE2 gene can be compared with the KCNE2 mRNA scheme. The KCNE2 mRNA scheme description is similar to Fig. 3C.

