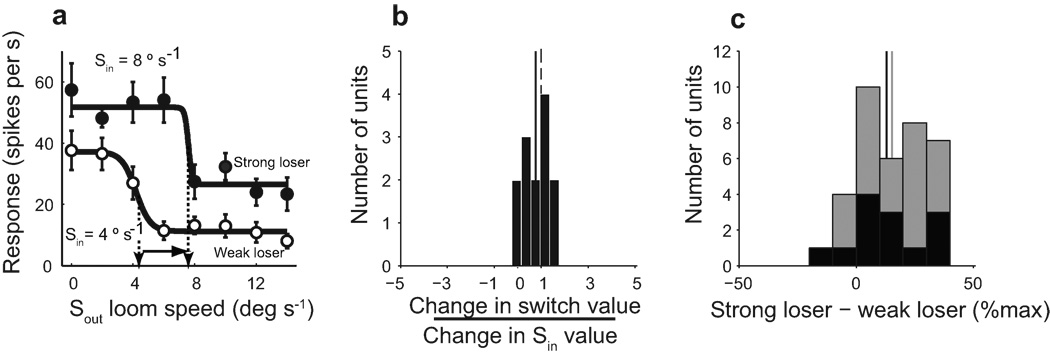
Figure 3. Effect of the strength of the Sin stimulus on switch value.
a) Competitor strength-response profiles for a switch-like unit measured with two different Sin loom speeds: 4 °/s (open symbols) and 8 °/s (filled symbols). Solid lines: sigmoidal fits to the data; vertical arrows: switch values; horizontal arrow: change in switch value. Error bars indicate s.e.m. b) Ratio of the change in switch value relative to the change in Sin loom speed for switch-like units. All data measured with looming Sin and Sout stimuli. Dashed vertical line: designates one; Solid vertical line: mean ratio for switch units = 0.77; Wilcoxon signed rank test re. 1, n=13, P=0.24. c) The difference between responses to a stronger, “loser” Sin stimulus versus a weaker, “loser” Sin stimulus. Black bars: switch-like units; gray bars: nonswitch-like units. For each unit, the difference is calculated as the average of the responses at Sout= 12 °/s and 14 °/s. The difference is expressed as a percentage of the maximum response to the stronger Sin stimulus presented alone. For switch-like units, an average increase in Sin strength of 4.3 ± 1.2 °/s produced an average response increase of 13 ± 4.7% (Wilcoxon signed rank test re. zero, n=13, P=0.021); for nonswitch-like units, an average increase in Sin strength of 4.5 ± 0.93 °/s produced an average response increase of 15.3 ± 3.5 % (Wilcoxon signed rank test re. zero, n=23, P<0.0001). Black and gray vertical lines represents mean for switch-like and nonswitch-like neurons respectively.

