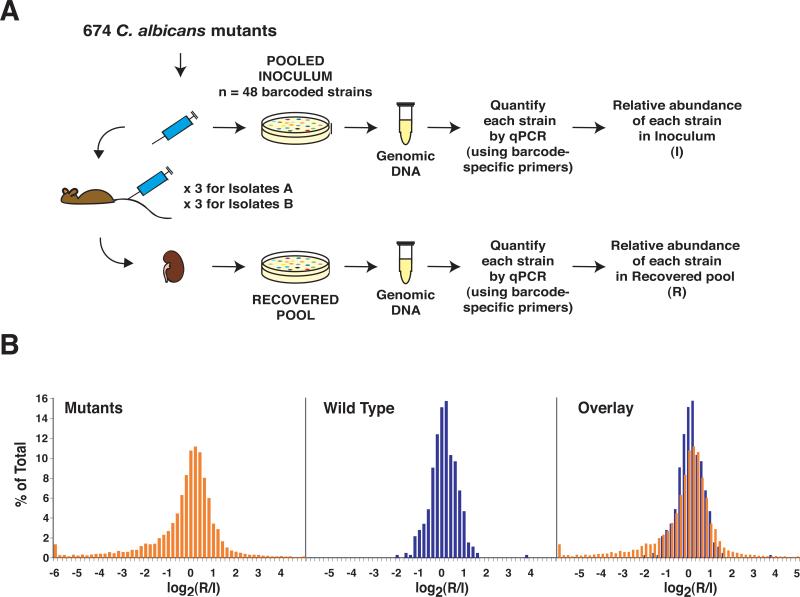
Figure 2. Infectivity screen.
A) Schematic of the Infectivity screen. Pools of up to 48 mutants and wild type were used to infect BALB/c mice. Samples of C. albicans from the infecting inoculum and recovered from mouse kidneys were plated on Sabouraud agar. Genomic DNA was recovered and the relative abundance of each strain in the inoculum (I) and the recovered pool (R) was determined by real-time PCR (qPCR), using primers specific to the DNA barcodes. B) Histograms depicting log2(R/I) values for C. albicans mutants (in orange), the wild type comparator (in blue), and the overlay between the two groups.

