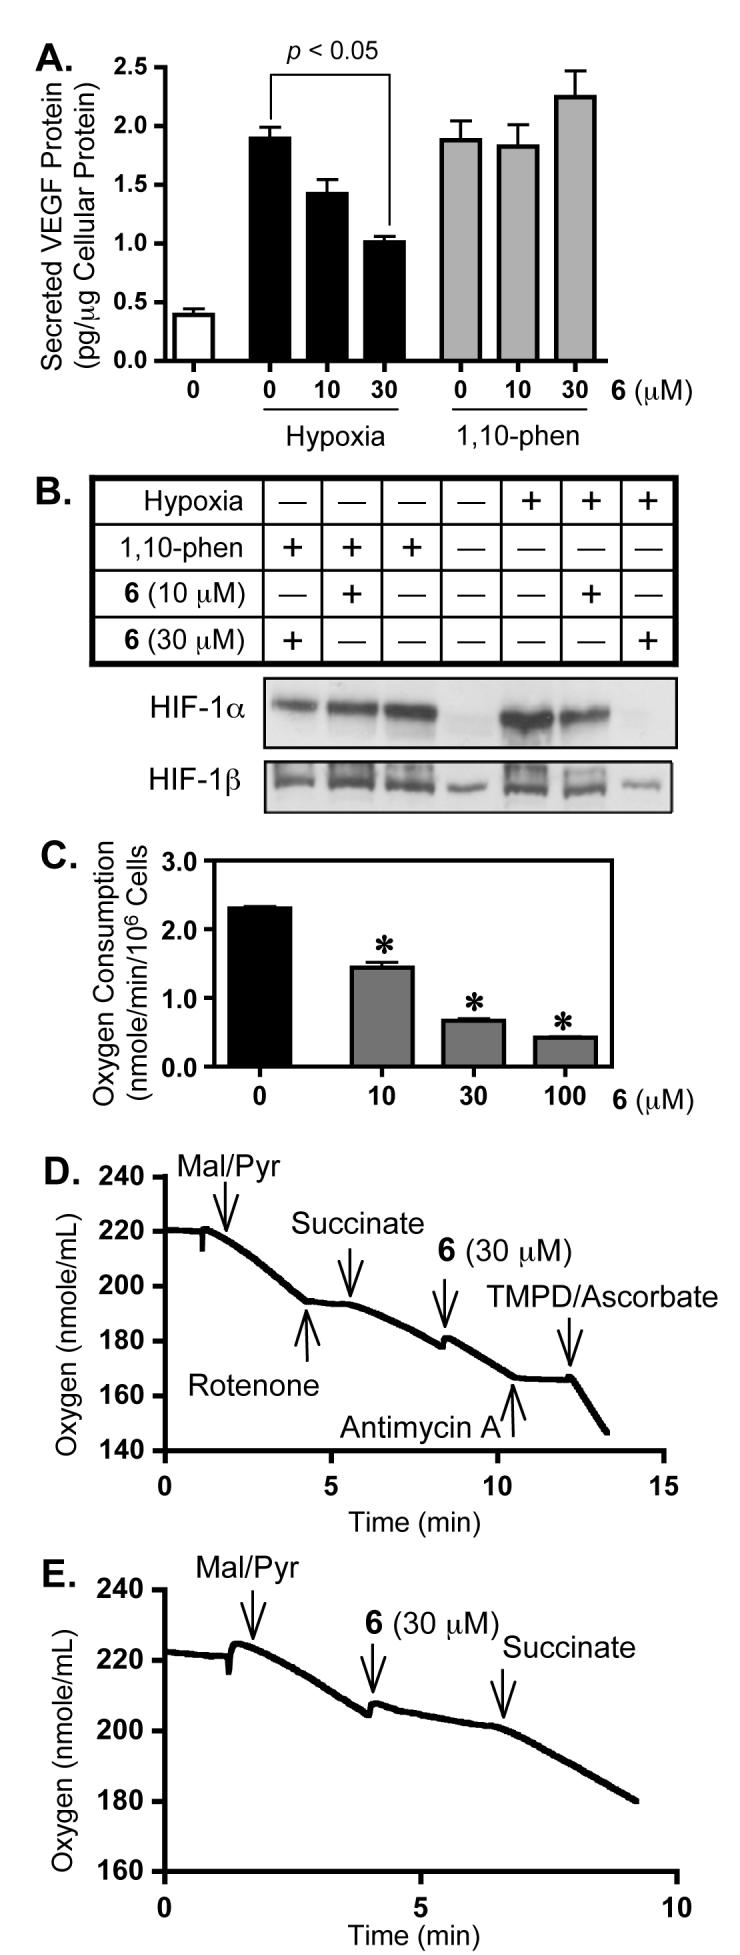
Figure 3. Compound 6 inhibits hypoxic induction of HIF-1 target VEGF protein (A) and blocks the induction of nuclear HIF-1 α protein accumulation (B). Compound 6 inhibits oxygen consumption in T47D cells (C) by disrupting complex I (E) but not complex II, III, and IV (D).

Data shown in (A) are averages from one representative experiment performed in T47D cells (n = 3 for each data point) and the bars represent standard error. Data were analyzed by one-way ANOVA, followed by Bonferroni post test using GraphPad Prism 4 software. The p value is provided in the figure when the inhibition is statistically significant. Data shown in (B) are Western blot results from a study evaluating the effects of 6 on the induction of nuclear HIF-1α protein and the nuclear accumulation of the constitutively expressed HIF-1β protein in T47D cells. The label “Hypoxia” correlates to a 4 h hypoxic exposure (1% O2/5% CO2/94% N2, 37°C), while “1,10-phen” represents a 4 h treatment with 1,10-phenanthroline at 10 μM. The concentration-dependent effects of 6 on oxygen consumption were examined in intact T47D cells with glucose as a substrate (C). Data shown are averages from one representative experiment performed in triplicate and an asterisk (*) indicates p < 0.05 when compared to the control by one-way ANOVA, followed by Bonferroni post test using GraphPad Prism 4 software. The effects of 6 on respiration of digitonin permeabilized T47D cells in the presence of various combinations of inhibitors and substrates were examined and representative data are shown (D and E). Abbreviations: Mal = malate; Pyr = pyruvate; TMPD = N,N,N’,N’-tetramethyl-p-phenylenediamine.
