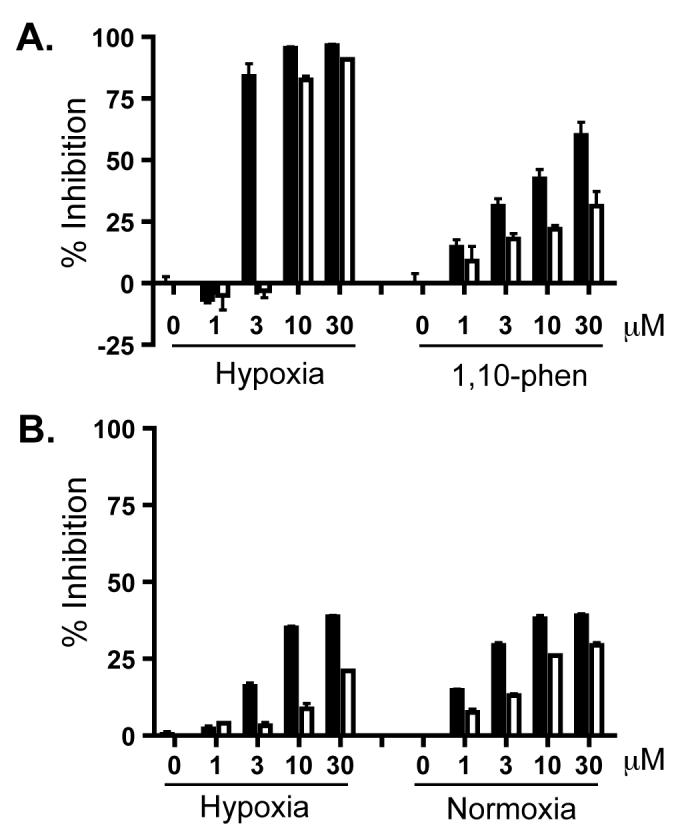
Figure 4. Comparison between 6 and a mixture of 6 and the hydrolyzed form 6a on HIF-1 inhibition (A) and suppression of cell proliferation/viability in T47D cells (B).

Data shown in (A) are averages from one representative T47D cell-based reporter assay performed in triplicate and the bars indicate standard error. The solid bars indicate pure 6 at each specified concentration and the open bars represent a mixture of 6 and 6a at equivalent concentrations. The label “Hypoxia” correlates to a 16 h hypoxic exposure (1% O2/5% CO2/94% N2, 37°C), while “1,10-phen” represents a 16 h treatment with 1,10-phenanthroline at 10 μM. Results from the 48 h cell proliferation/viability study are shown in (B). Data representation is similar to those specified in (A) except that the incubation time was 48 h and the label “Normoxia” refers to 95% Air/5% CO2.
