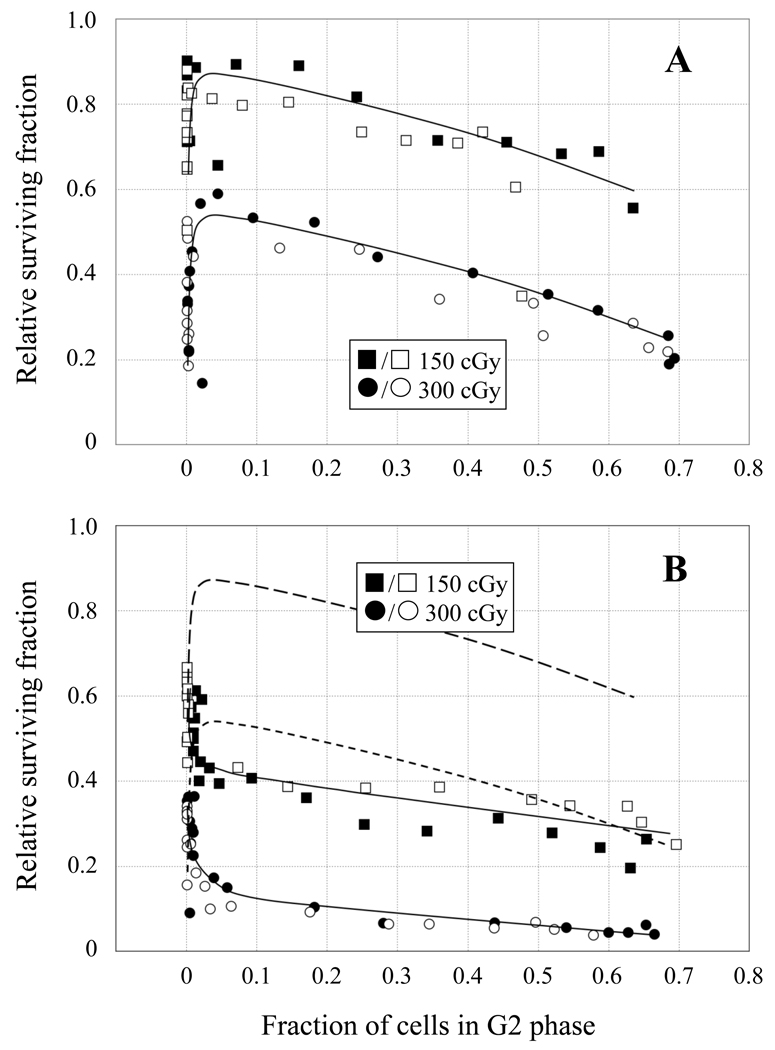
Fig. 2.
Relative survival of 51D1.3 (A) and 51D1 (B) cells after 150 cGy (squares) and 300 cGy (circles) γ-irradiation plotted against fraction of cells in G2 phase. Open and filled symbols represent survival data for two independent experiments conducted at each dose. Solid lines in both panels are best fit to the survival data; dashed lines in (B) are the best-fit lines of 51D1.3 survival data from (A) for comparison.

