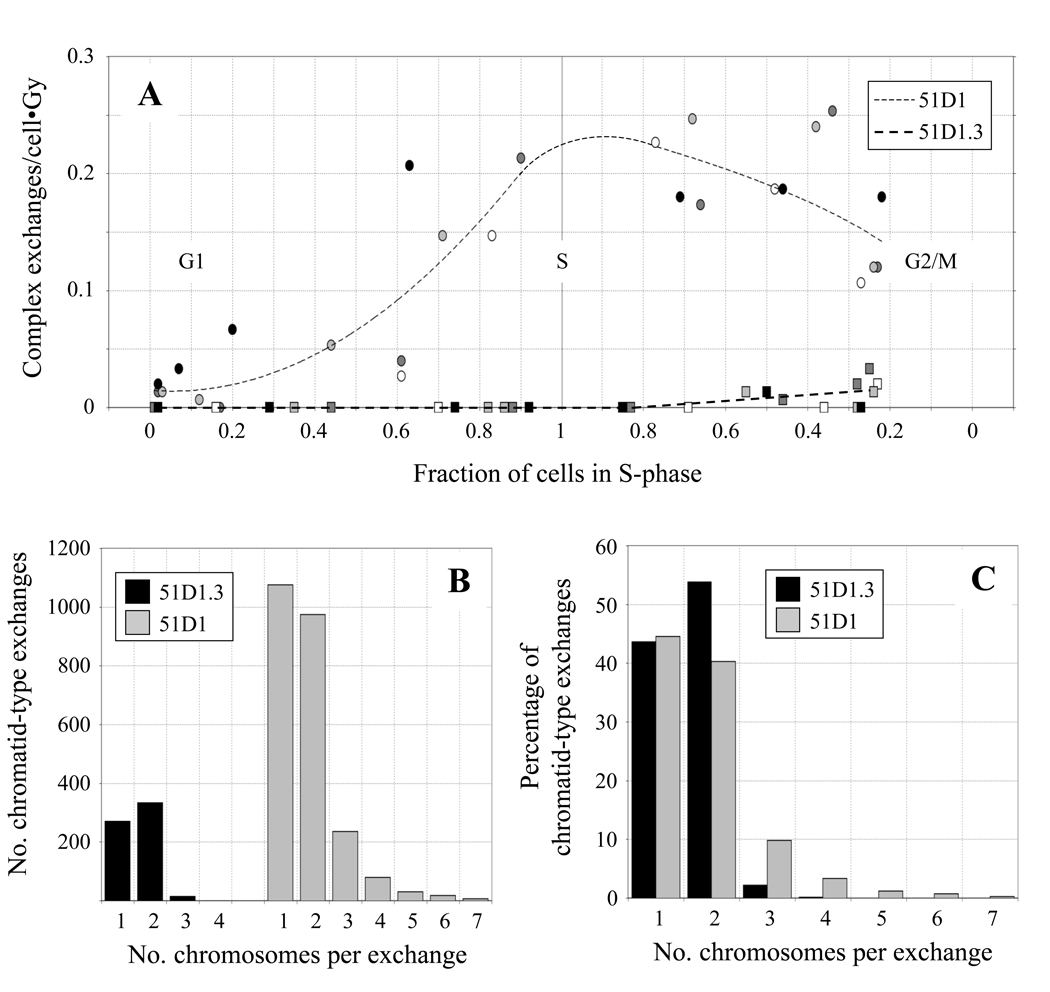
Fig. 5.
(A) Frequencies of complex exchange aberrations in 51D1 and 51D1.3 cells after 150 and 300 cGy γ-irradiation plotted against fraction of cells in S phase. CA frequencies are normalized per unit dose; symbols and fill colors are defined in Fig. 4. (B) Distribution of the number of chromosomes per chromatid-type exchange in 51D1 and 51D1.3 cells. (C) Distribution of the number of chromosomes per chromatid-type exchange relative to the percentage of chromatid-type exchanges in 51D1 and 51D1.3 cells.

