Figure 1.

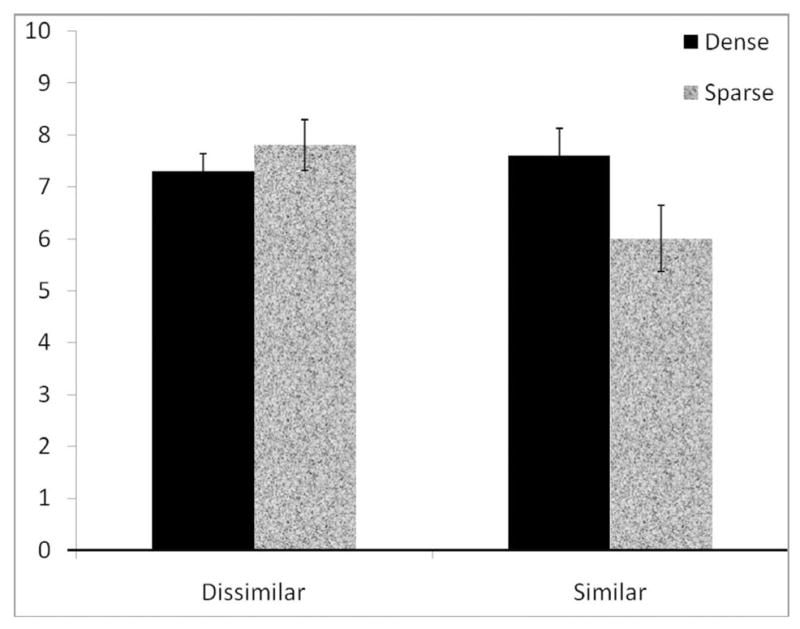
Number correct by test word conditions. Error bars represent the standard error of the mean. Graph includes data for participants in the high vocabulary group (n = 10).

Number correct by test word conditions. Error bars represent the standard error of the mean. Graph includes data for participants in the high vocabulary group (n = 10).