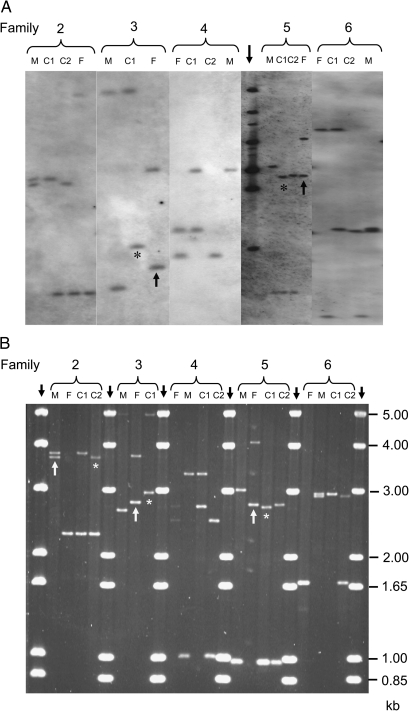
Fig. 1.
(A and B) Representative gel images obtained for Families 2–6 using the (A) Southern and (B) PCR-based CEB1 genotyping assays. The two sets of images were assembled independently by the two laboratories, the Southern images from five separate assays and the PCR images from a single gel. Family members are denoted as: F, father; M, mother; C1, Child 1; C2, Child 2. The vertical black downward arrows show the position of 1-kb allele-sizing ladders; this only approximates to allele sizes in the Southern images of Families 2, 3, 4 and 6 because assays were carried out on separate occasions. The asterisk shows germ line mutant bands and the vertical black upward arrows , the appropriate parental progenitor alleles.

