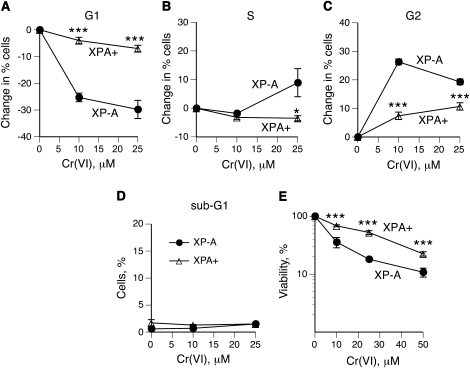
Fig. 2.
Cell cycle changes and survival of Cr(VI)-treated XP-A and XPA+ cells. Cell cycle distribution was determined by FACS of propidium iodide-stained nuclei. Data are means ± SDs from three independent measurements. Statistics: *P < 0.05 and ***P < 0.001 relative to XP-A cells. (A) Changes in percentage of cells in G1 phase. (B) Changes in percentage of cells in S phase. (C) Changes in percentage of cells in G2/M phase. (D) Percentage of cells with subdiploid amount of DNA. (E) Cytotoxicity of Cr(VI) treatments at 48 h post-exposure (means ± SDs, n = 4).

