Fig. 6.
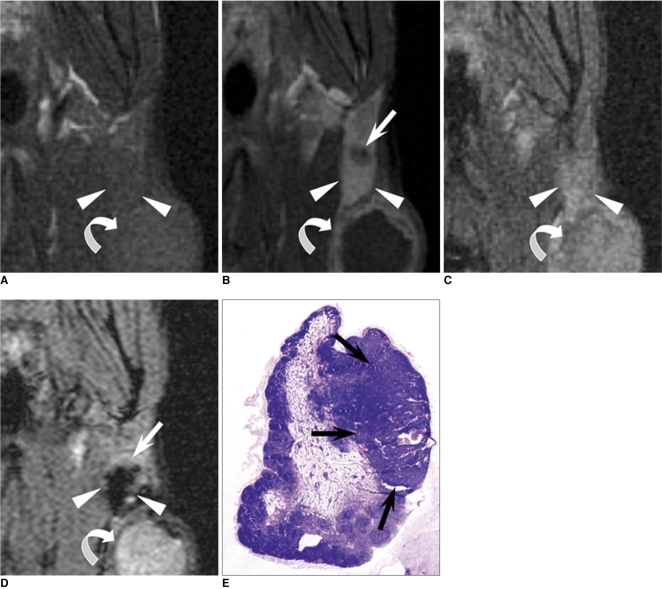
Coronal T1-weighted spin-echo MR images, T2*-weighted gradient-echo MR images and photomicrograph of left parotid lymph node of rabbit four weeks after VX2 tumor inoculation (Choi et al. [40], reprint with permission from Radiology).
A. T1-weighted spin echo image (400/12) obtained before injection of gadofluorine M shows left parotid lymph node (arrowheads) with low signal intensity, and VX2 tumor (curved arrow) with slightly high signal intensity.
B. T1-weighted spin-echo image (400/12) obtained 30 minutes after injection of gadofluorine M (0.05 mmol gadolinium per kilogram body weight) shows strong enhancement of functional tissue (arrowheads) of left parotid lymph node and malignant tissue (arrow) shows slight enhancement. High contrast between enhanced functional lymph node tissue and only slightly enhanced malignant tissue enables more obvious detection of metastasis than in (D). VX2 tumor (curved arrow) with peripheral rim enhancement is also noted.
C. T2*-weighted gradient-echo image (400/24, flip angle of 20°) obtained before injection of MION-47 shows left parotid lymph node (arrowheads) with high signal intensity, and VX2 tumor (curved arrow) with high signal intensity.
D. T2*-weighted gradient-echo image (400/24, flip angle of 20°) obtained 24 hours after injection of MION-47 (2.6 mg of iron per kilogram of body weight) shows functional tissue (arrowheads) of left parotid lymph node with uniform low signal intensity and peripheral malignant tissue (arrow) with high signal intensity, which shows poor contrast between malignant tissue and surrounding parenchymal tissue. High signal intense VX2 tumor (curved arrow) with peripheral low signal intensity is also noted.
E. Photomicrograph of histopathologic specimen shows malignant tissue (arrows) with maximum diameter of 2 mm in subcapsular portion of left parotid lymph node (Hematoxylin & Eosin stain; original magnification, ×5).

