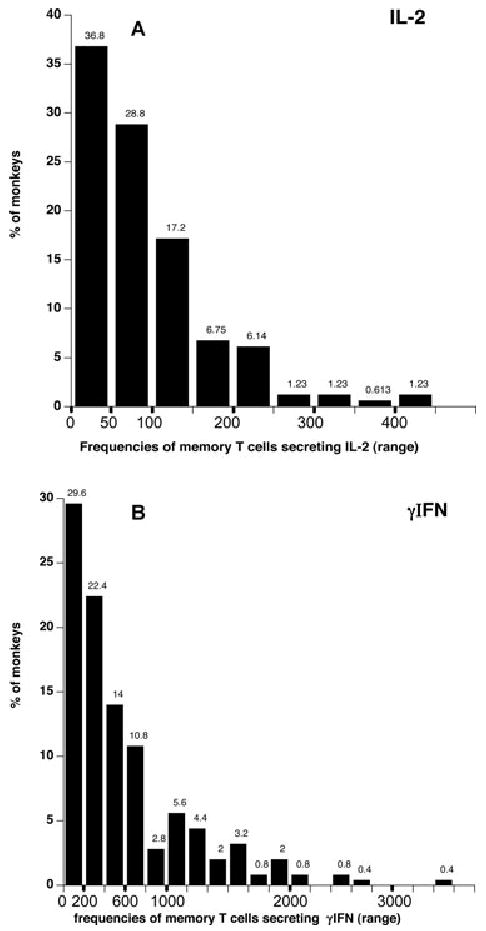
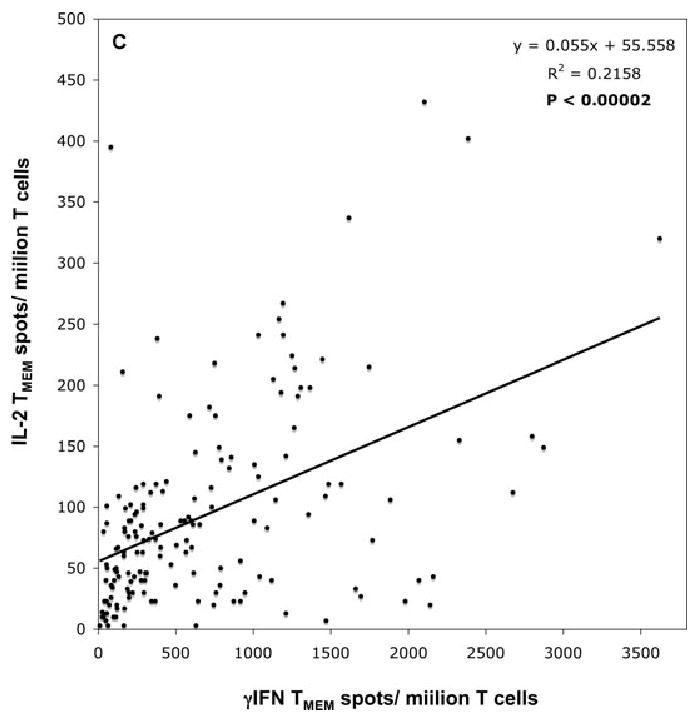
Figure 2. Distribution of the frequencies of donor-reactive TMEMs among all the stimulator-responder pairs.


(A) and (B) shows the frequencies of donor-reactive memory T cells secreting IL-2 (panel A) or γIFN (panel B) for each of 164 and 250 monkey combinations, respectively. The histograms represent the distributions of the frequencies of donor-reactive TMEMs among all the stimulator/responder pairs tested that is the percentages of monkey combinations (Y-axis) exhibiting a memory response whose level is comprised within a certain range of T-cell frequency (X-axis). The actual percentages are indicated above each bar. (C) shows the relationship between the frequencies of IL-2- and γIFN-producing memory T cells. R corresponds to the coefficient of correlation. The line shows the linear regression curve. The p-value was calculated using a paired t-test.
