
Figure 4. Influence of MHC disparity between responders and stimulators on the levels of memory alloreactivity.
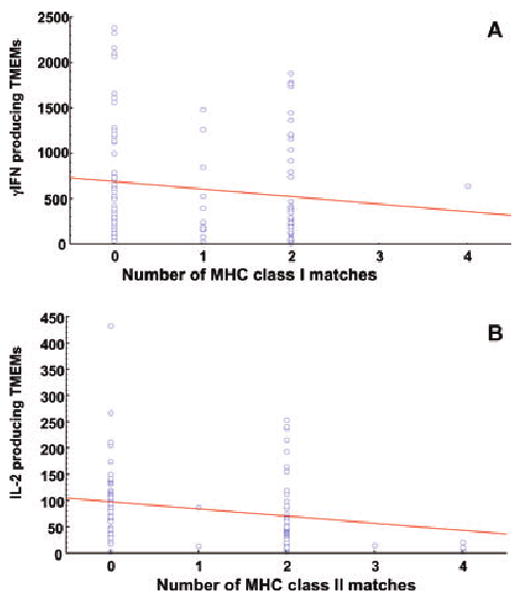
The frequencies of memory T cells producing γIFN (4A) or IL-2 (4B) as measured by ELISPOT in a series of responder/stimulator pairs (n = 98 for IL-2 and n = 111 for γIFN) sharing from 0 (fully disparate) to 4 (no disparity) alleles at the MHC class I (A and B alleles, panel A) or II (DP and DQ/DR alleles, panel B) loci. MHC class II DR and DQ genes were considered as a whole as none of the monkeys displayed a recombination between these two genes. Each dot represents the memory response measured for an individual responder/stimulator monkey pair. The lines represents the linear regression curves corresponding to the relationships between the levels of MHC class gene sharing and the magnitude of T cell memory alloreactivity.