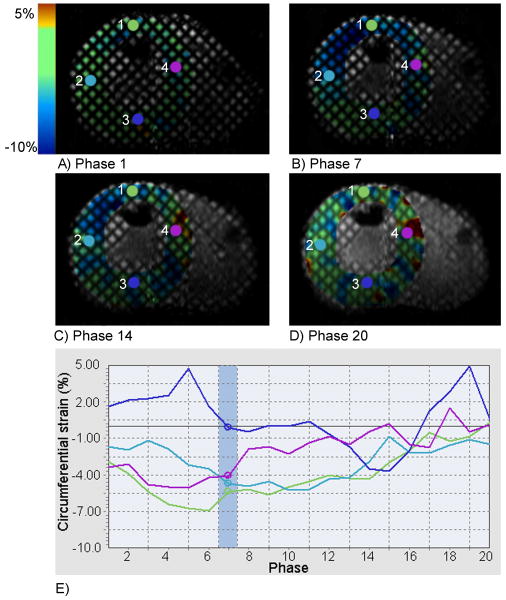
Figure 3.
Circumferential strain superimposed on the LV short-axis at beginning-systole (A), mid-systole (B), end-systole (C), and end-diastole (D). The circumferential strain values are plotted throughout the cardiac cycle (E) for the given probe locations (1-4) indicated in the short-axis images, where the phase at mid-systole is highlighted (Phase 7).

