
Figure 3. IL-12- and IFNα-dependent regulation of T-bet and eomesodermin mRNA expression.
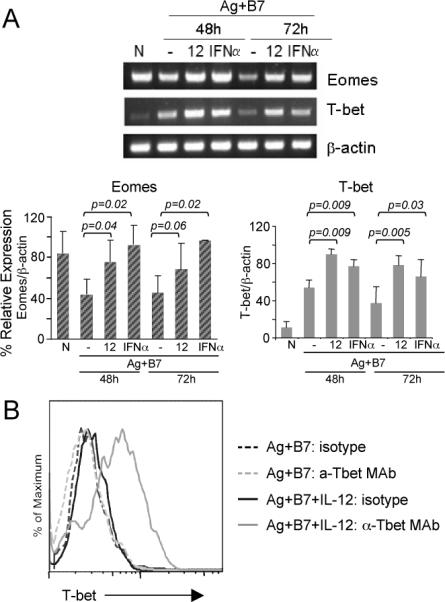
(A) Total RNA was isolated from naïve (CD44lo) OT-I CD8 T cells (0-h) or from purified OT-I CD8 T cells stimulated with Ag-B7 in presence of the indicated cytokines for 48 and 72h, and the mRNA expression level of T-bet and Eomes was determined by semi-quantitative RT-PCR. The linear range of amplification of transcripts was determined as described in Materials and Methods. The graphs represent mRNA quantification done by densitometry for three independent experiments. For each condition, the relative mRNA expression is shown as the mean ± S.D. Student's t-test was performed comparing IL-12 or IFNα with Ag-B7 alone and p-values are shown. (B) Naïve OT-I T cells were stimulated for 72hr with Ag-B7 alone or along with IL-12, as indicated, and the cells stained with anti-Tbet mAb or isotype control Ab and analyzed by flow cytometry.