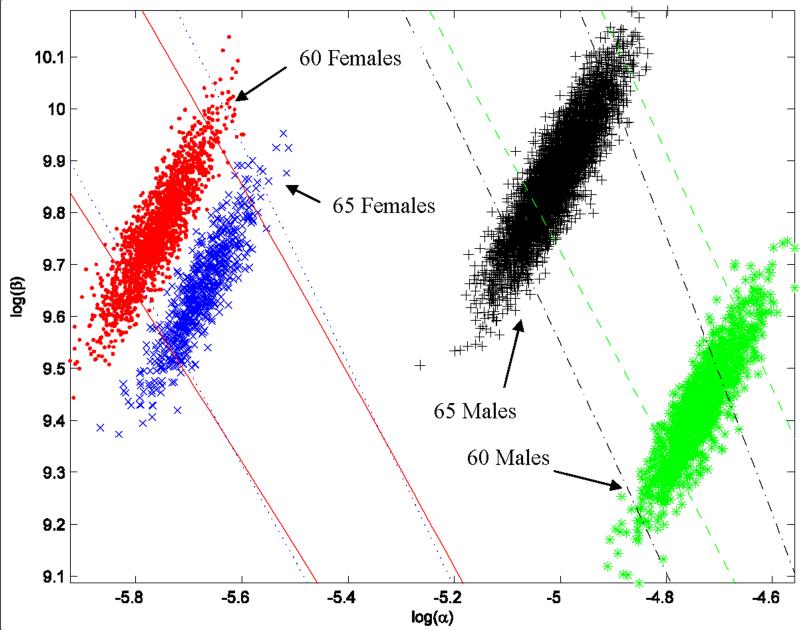
Figure 2.
Estimated distributions
The figure presents the estimated indifference sets for each age-gender cell, with a scatter plots from the estimated joint distribution of (logα,logβ) super-imposed; each point is a random draw from the estimated distribution in the baseline specification. The estimated indifference sets for the 65 year old males are given by the pair of dark dashed lines, for the 60 year old males by the pair of lighter dashed lines, for the 65 year old females by the pair of dotted lines, and for the 60 year old females by the pair of solid lines. The estimated indifference sets for the 65 year old males are the same as those shown in Figure 1 (but a “close up” and in log scale).

