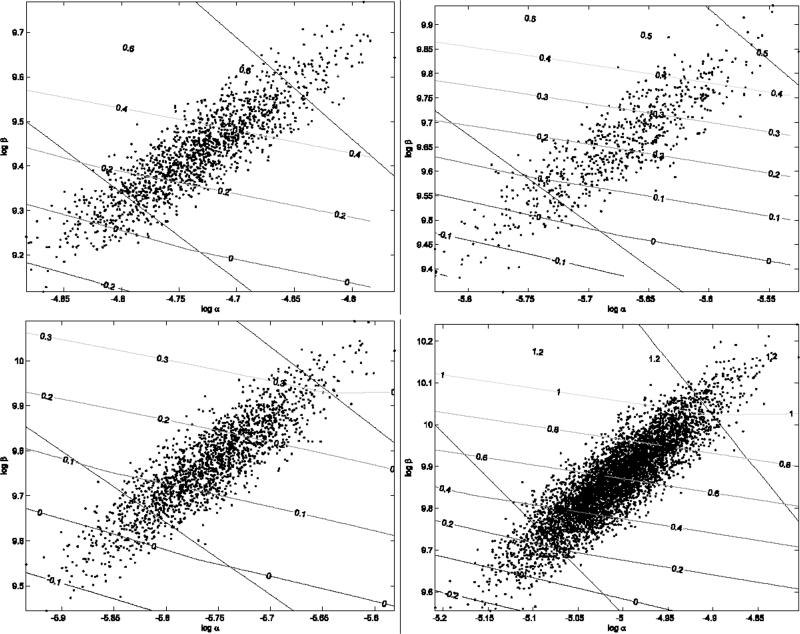
Figure 4.
Welfare change contours (symmetric information)
The figure presents Figure 2, with contour lines that present the change in welfare (wealth equivalent) from the counterfactual exercise of symmetric information. Individuals with positive (negative) welfare change are estimated to gain (lose) from symmetric information, compared to their welfare in the observed asymmetric information equilibrium. Each panel represents a different age-gender cell: 60 year old females (upper left), 65 year old females (upper right), 60 year old males (lower left), and 65 year old males (lower right).

